Skip to content
Ecological Intelligence

Ecological evidence.
Independent perspective.
Explore Wild Lands ↗

Morning Brief Global edition

October 4, 2026 · Issue 024

Today’s strongest thread is that ecological outcomes turn on upstream architecture: how habitat is arranged, how records are built, when organisms move and where thresholds sit. In Brazil’s Atlantic Forest, spotted-fever risk changes with forest configuration rather than forest amount alone; decades of estuarine monitoring give different salinity answers depending on provenance and quality handling; migratory birds gain or lose demographic advantage depending on which season shifts fastest; and northern-China grasslands cross different aridity thresholds above and below ground. Across markets, cities, rivers and oceans, the useful signal is increasingly the process that produced the measurement.

Land Manager Watch

Evidence for decisions on land, water and habitat

Peer-reviewed multi-scale river field analysis · Colorado River basin, Texas, USA

River mussel communities are sorting along flow regimes more consistently than along map scale

Across 480 Texas Colorado River sites, long-lived equilibrium species tracked stable flows, opportunists tracked zero-flow disturbance, and periodic species increased with flow variability.

Management read

For managers, mean discharge is not the whole habitat. If long-lived mussels are a conservation objective, monitoring should preserve the flow components that organisms actually experience—summer-flow persistence, zero-flow days, pulse duration and variability—and use those data alongside population surveys when evaluating water operations or drought response.

Caveat / uncertainty: This is an observational analysis from one Texas basin and does not establish a universal environmental-flow prescription. Host fish, substrate, water quality and connectivity also affect mussels, and life-history guilds summarize rather than replace species-specific requirements.

Read the full evidence, caveats & Land Manager analysis →

Editorial thread to watch

Three patterns recur. First, design precedes result: biodiversity-credit baselines, urban green-space structure and monitoring provenance set limits on what later claims can support. Second, averages hide directional asymmetry—spring versus autumn migration, rising versus falling salinity series, or restored marsh function versus carbon stocks. Third, intuitive interventions can change meaning once mechanism is included: riparian restoration can interact with zoonotic exposure, microplastic field effects are weaker and more heterogeneous than many laboratory narratives imply, and mussel life histories sort along flow components that mean discharge can hide. Decision-grade ecology keeps mechanism, scale and uncertainty attached to the headline.

Priority Reads

The evidence that deserves a closer look.

Forest configuration may change zoonotic risk in ways forest area alone does not
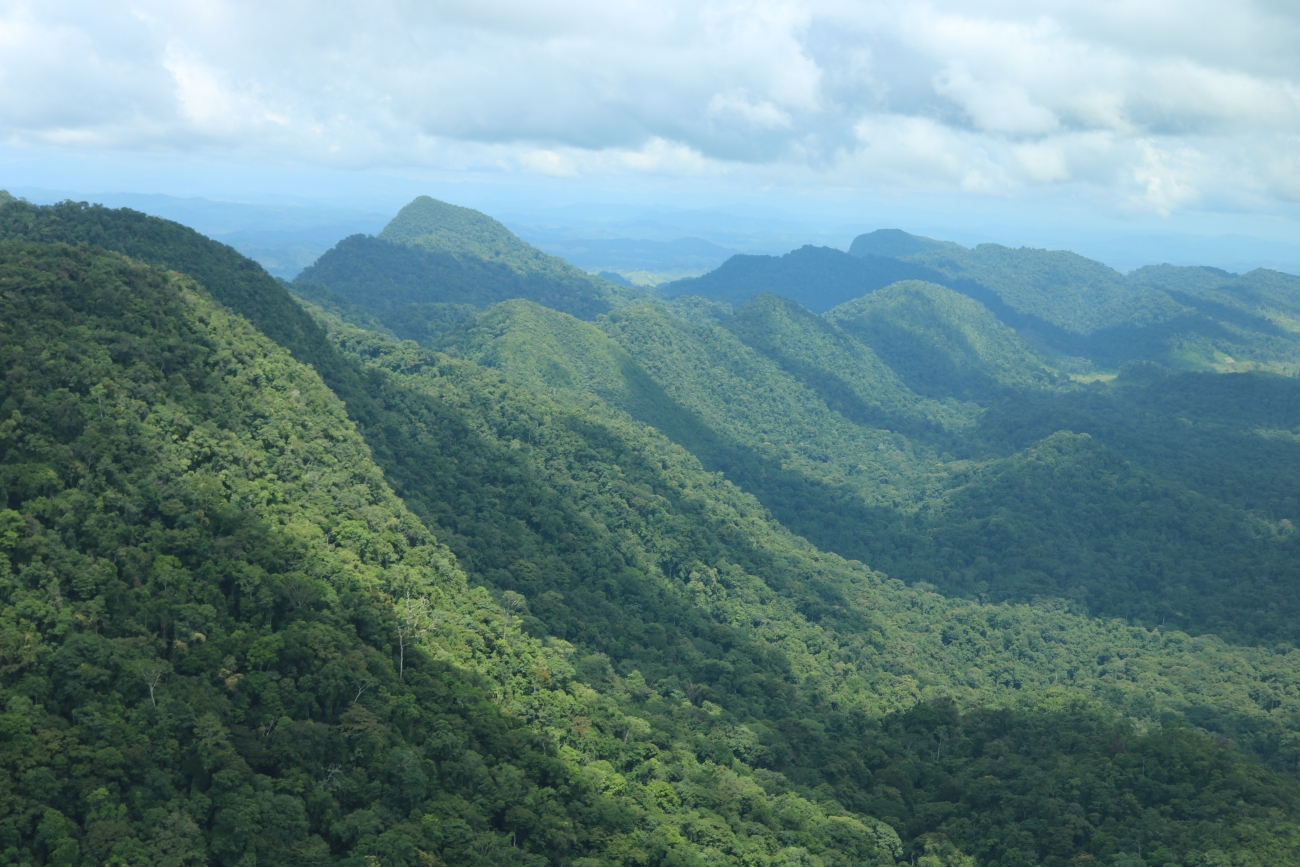
Illustrative repository image — Levi Novey/USFWS · Public Domain (USFWS) · Rights: Public domain

Forest configuration may change zoonotic risk in ways forest area alone does not

Brazilian spotted-fever incidence was highest in less fragmented Atlantic Forest landscapes where riparian forest sat inside pasture–agriculture mosaics—complicating simple “restore more riparian forest” prescriptions.

Evidence
Peer-reviewed observational landscape epidemiology
Geography
Brazilian Atlantic Forest municipalities
System
Atlantic Forest / agricultural mosaics

WHAT THE EVIDENCE SAYS

Using municipality-level Brazilian spotted-fever incidence from 2001–2019 with landscape and climate variables, mixed models found higher incidence in less fragmented landscapes when riparian forests were embedded in pastoral and agricultural mosaics. Cases also tended to be higher in cooler municipalities. The study treats landscape structure as part of the host–vector–human exposure system rather than assuming forest amount has one-directional effects.

WHY IT MATTERS / OUR READ

Restoration design can change exposure pathways as well as habitat. In disease-sensitive landscapes, where forest is placed and how it connects to old-growth forest, farms and people may matter as much as total restored area. The practical lesson is to integrate disease surveillance and landscape history into restoration planning instead of treating riparian planting as ecologically context-free.

CAVEATS / UNCERTAINTY

This is an observational municipality-level study and does not show that riparian restoration itself causes Brazilian spotted fever. Tick, host and human-exposure processes vary locally, and the policy implications require site-specific epidemiological and ecological validation.

SOURCE

Journal of Applied Ecology — primary study
View original evidence ↗

Read the Wild Lands assessment

Ninety-five million salinity records still change meaning when provenance and quality flags are handled differently

A source-aware screen of public estuarine and coastal monitoring found both rising and falling salinity series—and showed that aggregation and flagged observations can change the trend classification.

Evidence
Peer-reviewed public-data trend screening
Geography
Public estuarine and coastal monitoring networks, 1963–2026
System
Estuaries / coastal waters

WHAT THE EVIDENCE SAYS

The study harmonized about 95 million public salinity observations into 5,383 source-aware station entries from 13 data sources. Of 436 eligible long-term series, 99 showed nominal increases, 76 decreases and 261 no significant trend; false-discovery-rate correction reduced the significant set to 127. Annual aggregation reduced detections, and including flagged observations changed the trend class for 32 of 436 series.

WHY IT MATTERS / OUR READ

Long monitoring archives are not self-interpreting. Provenance, quality-control flags, sampling density and aggregation can change which estuaries appear to be freshening or salinizing. For coastal planning, a trend should travel with its source architecture rather than being treated as a property of the estuary alone.

CAVEATS / UNCERTAINTY

This is a screening analysis of public monitoring records, not an attribution study. Trend direction does not identify the driver, and differences among programs in sampling design and data quality remain part of the inference.

SOURCE

Estuarine, Coastal and Shelf Science — primary study
View original evidence ↗

Read the Wild Lands assessment

Earlier migration is not automatically better for birds—the season determines the demographic signal

Across 4,351 population-level estimates from 549 species, faster pre-breeding advancement was associated with population benefits while faster post-breeding advancement was associated with costs.

Evidence
Peer-reviewed global synthesis and full-annual-cycle model
Geography
Global migratory-bird populations
System
Migratory bird flyways

WHAT THE EVIDENCE SAYS

A global database paired 4,351 population-level migration-timing estimates across 549 species with population trends and climate change at breeding and non-breeding grounds. Migration timing advanced cumulatively by 13.86 days from 1970–2019. Faster advancement before breeding was associated with more favorable population trends, while faster post-breeding advancement was associated with less favorable trends; net benefit depended on spring advancement outpacing autumn change.

WHY IT MATTERS / OUR READ

Phenological adaptation has to be evaluated over the full annual cycle. A species can appear climate-responsive in one season while creating a mismatch in another, so migration monitoring and conservation planning should preserve season-specific timing rather than compressing behavior into one annual trend.

CAVEATS / UNCERTAINTY

These are macroecological associations combined with a theoretical model, not causal experiments for individual species. Coverage is uneven among species and flyways, and the result does not prescribe how a particular population should be managed.

SOURCE

Nature Ecology & Evolution — primary study
View original evidence ↗

Read the Wild Lands assessment

Aridification is separating above- and belowground biodiversity along different thresholds

A 4,000-km northern-China survey found plant, bacterial and fungal diversity declining beyond aridity thresholds while archaeal diversity increased and plant–microbe coupling reorganized.

Evidence
Peer-reviewed spatial field survey
Geography
Arid and semi-arid grasslands of northern China
System
Arid / semi-arid grasslands

WHAT THE EVIDENCE SAYS

Across a 4,000-km field survey, soil conditions and biological groups showed sequential threshold responses to aridity. Plant, bacterial and fungal diversity generally declined beyond their thresholds, while archaeal diversity increased. Salinity became more negatively associated with plants, bacteria and fungi as aridity increased, and plant–bacteria and plant–fungi diversity relationships strengthened in drier sites while plant–archaea relationships decoupled.

WHY IT MATTERS / OUR READ

A single biodiversity metric will miss how dryland systems reorganize. Aboveground plants and different microbial groups can cross different thresholds and even move in opposite directions, so resilience monitoring should couple vegetation with soil conditions and multiple microbial groups where feasible.

CAVEATS / UNCERTAINTY

The study substitutes a broad spatial aridity gradient for temporal change; it therefore identifies field associations and thresholds rather than experimentally proving the trajectory of future aridification. Results may be region- and taxon-specific.

SOURCE

Communications Earth & Environment — primary study
View original evidence ↗

Read the Wild Lands assessment

Global Radar

A wider field of view.

  1. Biodiversity-credit credibility is clustering around baseline design and who shares authority over the evidence

    Across 12 voluntary credit schemes, baseline/sampling design and co-governance were the two criteria that most consistently structured differences among schemes after multiple-testing correction.

    Evidence
    Peer-reviewed comparative institutional analysis
    Geography
    12 voluntary biodiversity-credit schemes operating across multiple regions
    System
    Conservation finance / biodiversity markets

    WHAT THE EVIDENCE SAYS

    Researchers evaluated 12 comparable voluntary biodiversity-credit schemes against 15 criteria spanning governance, rights and equity, credit integrity and biodiversity monitoring. In multivariate analysis, baseline and sampling design and co-governance were the criteria most consistently associated with differences among schemes after false-discovery-rate correction; several other criteria showed descriptive but non-significant associations.

    WHY IT MATTERS / OUR READ

    High-tech monitoring cannot rescue a weak counterfactual, and verification cannot substitute for legitimate authority over what is measured and credited. The useful due-diligence question is upstream: how was change defined, sampled and governed before a biodiversity unit was issued?

    CAVEATS / UNCERTAINTY

    The market is young and the analytical sample is small, geographically limited and based on documented scheme architecture rather than realized biodiversity outcomes. Schemes can also change quickly as standards mature.

    SOURCE

    Communications Sustainability — primary study
    View original evidence ↗

    Read the Wild Lands assessment
  2. Central Europe’s growing season is lengthening fastest in some managed land covers

    MODIS land-surface phenology from 2000–2022 found earlier starts and later ends across arable land, forests and grassland, with the strongest shifts often in arable areas and lower elevations.

    Evidence
    Peer-reviewed remote-sensing time-series study
    Geography
    Central Europe
    System
    Agricultural land / forests / grasslands

    WHAT THE EVIDENCE SAYS

    Two-band MODIS vegetation-index records for 2000–2022 showed earlier growing-season starts, later ends and longer seasons across arable land, broad-leaved forest, coniferous forest and grassland. Median start-of-season trends ranged roughly from 9.3 to 17.5 days earlier per decade and season length increased by about 13.3 to 25 days per decade, with arable land showing especially strong changes and elevation modifying the pattern.

    WHY IT MATTERS / OUR READ

    Phenology is partly climate signal and partly land-management signal. Comparing land-cover classes and elevation bands helps separate where a longer remote-sensing growing season may reflect altered cropping or vegetation behavior rather than a uniform biological response.

    CAVEATS / UNCERTAINTY

    The metrics are satellite land-surface phenology, not direct species-level phenology. The 2000–2022 trends are observational, and climate and agricultural management can contribute simultaneously.

    SOURCE

    Regional Environmental Change — primary study
    View original evidence ↗

    Read the Wild Lands assessment
  3. At global scale, land-surface climate effects may be governed more by radiation than by local evaporative cooling

    Idealized Earth-system experiments found global-mean temperature response scaling with planetary-albedo change even when local hydrologic effects were strong.

    Evidence
    Peer-reviewed Earth-system modeling study
    Geography
    Global / idealized latitudinal land-surface perturbations
    System
    Terrestrial land surface / climate system

    WHAT THE EVIDENCE SAYS

    Earth-system-model experiments altered surface albedo or water availability over large latitudinal bands. Although hydrologic changes strongly affected local temperatures through evapotranspiration, their spatially integrated global temperature signal was dominated by radiative changes, approximately 0.4 K per W m−2 change in top-of-atmosphere net short-wave radiation. Regional cloud response strongly modified the effect.

    WHY IT MATTERS / OUR READ

    Local cooling and global climate effect are not interchangeable metrics. Land-cover decisions can have large local hydrologic consequences while their global biophysical temperature signal follows a different mechanism through planetary albedo and clouds.

    CAVEATS / UNCERTAINTY

    The core experiments are idealized and rely heavily on one Earth-system model; cloud sensitivity is model-dependent. The authors compare against multi-model experiments, but project-scale land decisions should not be converted directly into a universal temperature factor.

    SOURCE

    Nature Communications — primary study
    View original evidence ↗

    Read the Wild Lands assessment
  4. A familiar barcode can miss much of the species structure in a sponge genus

    Five genetic markers plus systematic photographs of 192 Western Mediterranean Oscarella specimens resolved four species new to science and exposed low resolution in the commonly used COI marker.

    Evidence
    Peer-reviewed integrative taxonomy study
    Geography
    Western Mediterranean
    System
    Marine benthic / rocky reef

    WHAT THE EVIDENCE SAYS

    Researchers combined 192 Oscarella specimens, five genetic markers and standardized photographic documentation. Multigene analyses supported four species new to science and highlighted weak resolution in the commonly used COI marker, along with broader gaps in genetic reference data and geographic coverage.

    WHY IT MATTERS / OUR READ

    Monitoring is only as good as the taxonomic reference behind it. A convenient marker can under-resolve real diversity, which matters when eDNA, barcoding and biodiversity assessments assume the reference library already captures the organisms present.

    CAVEATS / UNCERTAINTY

    This is one morphologically difficult sponge genus in the Western Mediterranean. The limits of COI here should not be generalized unchanged to every taxon or metabarcoding application.

    SOURCE

    Scientific Reports — primary study
    View original evidence ↗

    Read the Wild Lands assessment
  5. Contaminated soils can become a secondary atmospheric source instead of a passive sink

    Air–soil measurements across agricultural, urban and industrial landscapes in Khyber Pakhtunkhwa found warmer-season POP elevations and fugacity evidence of remobilization from some soils.

    Evidence
    Peer-reviewed environmental field monitoring
    Geography
    Peshawar, Swabi and Haripur, Khyber Pakhtunkhwa, Pakistan
    System
    Agricultural / urban / industrial landscapes

    WHAT THE EVIDENCE SAYS

    Measurements of DDTs, HCHs and PCBs in air and soil across agricultural, urban and industrial sites showed strong spatial and seasonal variation. Concentrations were often elevated in warmer pre-monsoon and monsoon periods, and fugacity calculations indicated that some contaminated soils can act as secondary emission sources that remobilize persistent pollutants into the atmosphere.

    WHY IT MATTERS / OUR READ

    Legacy contamination is dynamic. A soil that stores pollutants in one season can become a source in another, so risk assessment and monitoring need to account for exchange processes rather than treating old residues as permanently immobilized.

    CAVEATS / UNCERTAINTY

    The study covers three Pakistani cities and source attribution is inferential. Concentration reporting in the early article version contains formatting irregularities, so the edition avoids over-interpreting exact ranges and focuses on the robust seasonal/exchange pattern.

    SOURCE

    Scientific Reports — primary study
    View original evidence ↗

    Read the Wild Lands assessment
  6. Mediterranean shoreline connectivity is low enough that ships can leave a genomic fingerprint

    Population genomics and particle tracking found strong local retention in two topshells while matching genotypes more than 1,000 km apart pointed to human-mediated long-distance transport.

    Evidence
    Peer-reviewed population genomics and oceanographic modeling
    Geography
    Western and eastern Mediterranean coasts from Spain to Israel
    System
    Rocky intertidal marine coast

    WHAT THE EVIDENCE SAYS

    For two sympatric Phorcus topshells, short particle-tracking runs showed strong local retention and even 90-day simulations did not connect the western and eastern Mediterranean basins. Genomic structure supported low natural connectivity, while near-identical profiles between localities separated by more than 1,000 km—near major ports—were inconsistent with a simple coastal stepping-stone pattern and supported human-mediated dispersal.

    WHY IT MATTERS / OUR READ

    Connectivity models should include transport pathways created by people. Natural currents can imply strong isolation while ports and vessels create rare jumps that reorganize population structure and potentially move species or genotypes across barriers.

    CAVEATS / UNCERTAINTY

    Ship-mediated dispersal is inferred from the mismatch between natural-dispersal modeling, genomic similarity and port geography rather than observed directly on vessels. Results are species- and region-specific, and particle simulations simplify larval behavior.

    SOURCE

    ICES Journal of Marine Science — primary study
    View original evidence ↗

    Read the Wild Lands assessment
  7. Young fish are shifting in space and season on different clocks

    A 1995–2018 synthesis of 21,737 Northeastern Pacific sampling events found significant spatial or seasonal shifts in only subsets of species and metrics, rather than one coherent climate-response direction.

    Evidence
    Peer-reviewed multi-program observational synthesis
    Geography
    Northeastern Pacific from Alaska through the California Current
    System
    Marine pelagic / early-life-stage fish habitat

    WHAT THE EVIDENCE SAYS

    Six sampling programs contributed 21,737 unique events from 1995–2018. Significant changes appeared in different metrics for different taxa: for example, chub and jack mackerel shifted seasonal centers of gravity while several sanddabs and other species shifted latitudinal metrics. Spatial and phenological variability were not tightly coupled, and most environmental covariates did not show simple linear trends across the full domain.

    WHY IT MATTERS / OUR READ

    Range shift and timing shift should not be treated as interchangeable evidence of climate response. Survey design and life stage matter, and management may need to track geography and phenology separately for recruitment-sensitive species.

    CAVEATS / UNCERTAINTY

    The synthesis combines programs with different regions and sampling structures, and significance varies by species and metric. The results describe early life stages rather than whole-stock distribution and do not assign every shift to a single environmental cause.

    SOURCE

    ICES Journal of Marine Science — primary study
    View original evidence ↗

    Read the Wild Lands assessment
  8. A restored marsh recovered microbial activity before it recovered its carbon stock

    Two eastern-Ontario marshes had similar microbial biomass and enzyme activity even though the restored marsh held only about half the soil carbon of the intact marsh.

    Evidence
    Peer-reviewed comparative field study
    Geography
    Two freshwater marshes in eastern Ontario, Canada
    System
    Freshwater marsh / wetland

    WHAT THE EVIDENCE SAYS

    Nine sampling locations across one intact and one restored freshwater marsh spanned permanent, intermittent and non-inundated conditions. Permanent inundation was associated with lower microbial biomass-related ratios and enzyme activities. Despite the restored marsh having about half the soil carbon concentration of the intact marsh, microbial biomass and measured enzyme activities were similar between marshes.

    WHY IT MATTERS / OUR READ

    Process recovery and stock recovery can run on different timelines. A restoration can regain parts of microbial functioning while soil carbon remains far from the reference condition, so success metrics should distinguish activity, composition and accumulated stocks.

    CAVEATS / UNCERTAINTY

    Only two marshes and nine locations were studied, so restoration history and site differences are confounded. Similar microbial activity does not establish equivalent long-term carbon burial, and the authors explicitly note that higher activity could have positive or negative implications for continued carbon storage.

    SOURCE

    Freshwater Biology — primary study
    View original evidence ↗

    Read the Wild Lands assessment
  9. Six thousand recorder-days reveal overlapping but different whale seasons in the Mascarene waters

    Passive acoustics found fin, Antarctic blue and Madagascar pygmy blue whale songs across all sampled sites, with strong seasonality and much sparser Antarctic-blue occurrence.

    Evidence
    Peer-reviewed passive-acoustic monitoring study
    Geography
    Mascarene waters, southwestern Indian Ocean
    System
    Open-ocean marine mammal habitat

    WHAT THE EVIDENCE SAYS

    Sixteen ocean-bottom recorders provided more than 6,000 days of recordings. Fin-whale 20-Hz songs occurred on an average 43% of recording days and could span up to roughly eight months at a site. Antarctic blue-whale songs were detected at all sites but on about 13% of recording days on average, concentrated mainly outside austral spring–summer, with geographic exceptions. Madagascar pygmy blue whales also showed strong seasonal occurrence.

    WHY IT MATTERS / OUR READ

    Sparse visual sightings can make a marine corridor look empty. Long-duration passive acoustics reveals when different large whales overlap the same broad seascape and can help time surveys, shipping-risk assessment or other monitoring around actual seasonal presence.

    CAVEATS / UNCERTAINTY

    Acoustic presence is not abundance, and calling behavior varies by species, sex, season and context. Recorder placement and detectability also shape apparent occurrence, so silence cannot be treated as confirmed absence.

    SOURCE

    ICES Journal of Marine Science — primary study
    View original evidence ↗

    Read the Wild Lands assessment
  10. One estuary can organize twelve taxonomic groups along the same gradient without making them respond the same way

    Across marsh and river habitats of the Elbe Estuary, salinity was the most consistent axis of community turnover, while alpha-diversity responses varied among taxa.

    Evidence
    Peer-reviewed multi-taxon estuarine field study
    Geography
    Elbe Estuary, Germany
    System
    Estuary / salt marsh / river

    WHAT THE EVIDENCE SAYS

    The study analyzed alpha- and beta-diversity across 12 groups of microbes, plants and animals spanning marsh and river habitats. Salinity was a major environmental axis across land and water; flooding frequency mattered in marshes and suspended particulate matter in the river. Community composition changed strongly along the estuarine gradient across most taxa, while alpha-diversity responses were more taxon-specific.

    WHY IT MATTERS / OUR READ

    Ecotones are organized by gradients, not by a single habitat label. As freshwater inflow, sea level or salinity regimes shift, managers should expect community turnover to move unevenly across taxa and across the land–water boundary.

    CAVEATS / UNCERTAINTY

    This is one large European estuary and an observational snapshot of multiple taxa. Salinity is an organizing axis, not the only driver, and taxonomic groups differed in which environmental variables best explained their diversity.

    SOURCE

    Estuarine, Coastal and Shelf Science — primary study
    View original evidence ↗

    Read the Wild Lands assessment

Landscape / City Watch

Cities are ecological systems.

Urban green space is losing bird functional space before every diversity metric agrees

Across 24 Harbin green-space patches, species richness declined with urbanization and occupied trait space contracted, while the functional-richness trend itself was sensitive to spatial modeling.

Evidence
Peer-reviewed urban field survey and trait analysis
Geography
Harbin, Northeast China
System
Urban green space / blue-green network

WHAT THE EVIDENCE SAYS

Bird communities across 24 urban green-space patches were analyzed against a composite urbanization gradient. Species richness declined consistently; two-dimensional functional space occupied by the community also contracted, especially for larger-bodied, higher hand-wing-index and aquatic-associated traits. Functional richness declined too, but that result was sensitive to how residual spatial structure was modeled. Water-body cover, vegetation cover and foliage-height diversity were associated with different functional groups.

WHY IT MATTERS / OUR READ

Urban biodiversity design should not treat every green polygon as equivalent. Water, vertical vegetation structure and blue–green connectivity can retain different parts of the avian trait space, while a single richness score may not reveal which ecological functions are disappearing.

CAVEATS / UNCERTAINTY

The study is cross-sectional and limited to 24 patches in one city. Trait–habitat relationships are associations rather than experimental treatment effects, and the functional-richness result is explicitly model-sensitive.

SOURCE

Journal of Applied Ecology — primary study
View original evidence ↗

Read the Wild Lands assessment

October 4, 2026 · Issue 024

Today’s strongest thread is that ecological outcomes turn on upstream architecture: how habitat is arranged, how records are built, when organisms move and where thresholds sit. In Brazil’s Atlantic Forest, spotted-fever risk changes with forest configuration rather than forest amount alone; decades of estuarine monitoring give different salinity answers depending on provenance and quality handling; migratory birds gain or lose demographic advantage depending on which season shifts fastest; and northern-China grasslands cross different aridity thresholds above and below ground. Across markets, cities, rivers and oceans, the useful signal is increasingly the process that produced the measurement.

Land Manager Watch

Evidence for decisions on land, water and habitat

Peer-reviewed multi-scale river field analysis · Colorado River basin, Texas, USA

River mussel communities are sorting along flow regimes more consistently than along map scale

Across 480 Texas Colorado River sites, long-lived equilibrium species tracked stable flows, opportunists tracked zero-flow disturbance, and periodic species increased with flow variability.

Management read

For managers, mean discharge is not the whole habitat. If long-lived mussels are a conservation objective, monitoring should preserve the flow components that organisms actually experience—summer-flow persistence, zero-flow days, pulse duration and variability—and use those data alongside population surveys when evaluating water operations or drought response.

Caveat / uncertainty: This is an observational analysis from one Texas basin and does not establish a universal environmental-flow prescription. Host fish, substrate, water quality and connectivity also affect mussels, and life-history guilds summarize rather than replace species-specific requirements.

Read the full evidence, caveats & Land Manager analysis →

Editorial thread to watch

Three patterns recur. First, design precedes result: biodiversity-credit baselines, urban green-space structure and monitoring provenance set limits on what later claims can support. Second, averages hide directional asymmetry—spring versus autumn migration, rising versus falling salinity series, or restored marsh function versus carbon stocks. Third, intuitive interventions can change meaning once mechanism is included: riparian restoration can interact with zoonotic exposure, microplastic field effects are weaker and more heterogeneous than many laboratory narratives imply, and mussel life histories sort along flow components that mean discharge can hide. Decision-grade ecology keeps mechanism, scale and uncertainty attached to the headline.