Skip to content
Ecological Intelligence

Ecological evidence.
Independent perspective.
Explore Wild Lands ↗

Morning Brief Global edition

October 14, 2026 · Issue 029

This morning’s strongest evidence asks us to separate a visible ecological state from the mechanism underneath it. Marsh stems in a severe wave-flume test bent rather than disappeared; almost two decades of stream-restoration monitoring showed year-to-year variation hiding expected watershed-wide changes; and Rwandan home gardens connected more birds and native woody plants than a landscape dominated by planted exotic tree cover. A worldwide road-effects synthesis likewise found an average wildlife cost that depends on the outcome and effect scale. Taken together, these are arguments for testing what actually functions, not just what a map, treatment label or headline number says.

Land Manager Watch

Evidence for decisions on land, water and habitat

Peer-reviewed · Dry ponderosa pine forests, Pacific Northwest United States

Frequent prescribed fire reduced shrub cover, but the wildlife-habitat tradeoff persisted

A long-term ponderosa-pine experiment found 5-year burns kept fuels and bitterbrush low, while 10- and 20-year regimes allowed different shrub and herb-layer outcomes.

Management read

Choose fire-return schedules from an explicit map of desired fuel, wildlife-forage and understory states rather than treating frequent burning as one universal prescription. A spatial mosaic of untreated patches and differently burned units may preserve habitat diversity while meeting fuels objectives.

Caveat / uncertainty: Results come from a particular long-term dry-forest experiment; fire severity, past stand structure, missed treatments and species composition matter. No fixed 5-, 10- or 20-year schedule is a site-independent recommendation.

Read the full evidence, caveats & Land Manager analysis →

Editorial thread to watch

Three mismatches run through this issue. First, a mapped or modeled capacity is not an observed outcome: coastal resilience indices, urban ecological footprints and 3-D fuel scans answer different questions from field performance. Second, ecological improvement is multidimensional: Taipei’s water chemistry improved while a microbial indicator did not, and rare Chinese forest species persisted without filling every growth stage. Third, restoration is a trajectory with tradeoffs: salmon streams need long monitoring horizons, prescribed-fire intervals shift wildlife forage and understory composition, and Rwanda’s gardens help without replacing native forest. Today’s Land Manager Watch follows the practical consequences of that last distinction.

Priority Reads

The evidence that deserves a closer look.

Marsh vegetation survived extreme waves by bending, not simply resisting
Illustrative USFWS wetland landscape — Monica Tomosy; not the Dutch experimental site. · Public Domain (USFWS) · Rights: Public domain

Marsh vegetation survived extreme waves by bending, not simply resisting

A full-scale Dutch wave-flume experiment found roughly 30% average aboveground biomass loss in severe simulated storms; flexible stems persisted most readily.

Evidence
Peer-reviewed
Geography
Deltares wave flume, Netherlands; vegetation from northwestern European tidal marshes
System
Tidal salt marsh; storm-wave exposure

WHAT THE EVIDENCE SAYS

Researchers tested winter-state stems of Spartina anglica, Scirpus maritimus and Phragmites australis plus engineered mimics under waves up to 2 m significant height, 4 m water depth and 8-second peak periods. Mean proxy biomass loss was about 30%; bending and flexibility often spared stems, while stiff stems broke more readily. Enough standing height remained to support some wave interaction after the storm.

WHY IT MATTERS / OUR READ

Flood-protection plans should model not just whether marsh vegetation exists, but its winter stem traits and the canopy left after an extreme event. Stem survival is a measurable mechanism linking habitat condition to the services a marsh may continue providing.

CAVEATS / UNCERTAINTY

This was a controlled flume trial with three plant species and mimics, not a multi-year field test of marsh survival or coastline protection. Breakage is not identical to erosion, elevation change or actual reductions in flood damage; local hydrodynamics and sediment supply remain decisive.

SOURCE

Communications Sustainability — primary flume experiment
View original evidence ↗
Read the Wild Lands assessment

After two decades of stream work, watershed-wide habitat signals were often missing

Thousands of habitat surveys across ten Washington watersheds found interannual changes often larger than long-term trends or expected restoration contrasts.

After two decades of stream work, watershed-wide habitat signals were often missing
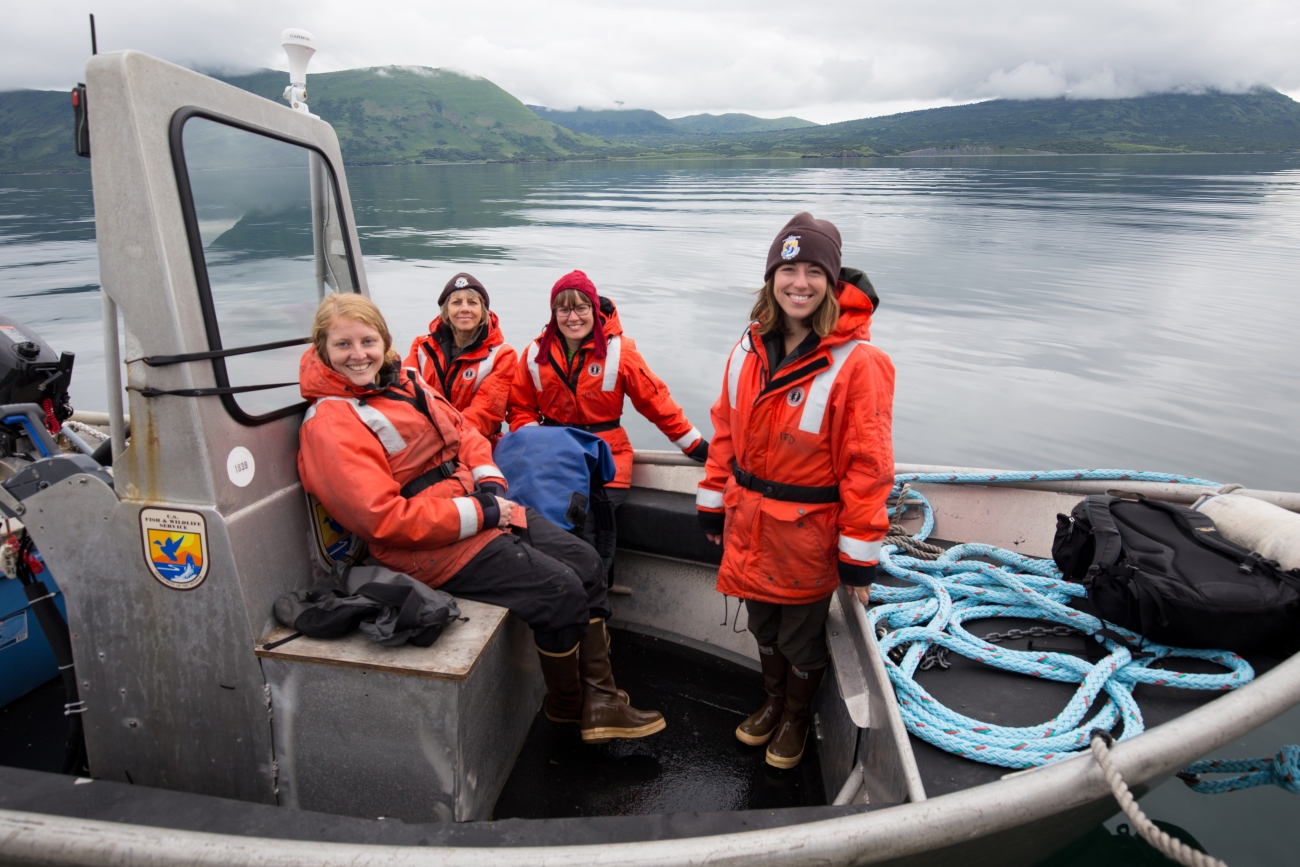
Illustrative USFWS field-biology scene — Lisa Hupp/USFWS; not a study-site photo. · Public Domain (USFWS) · Rights: Public domain
Evidence
Peer-reviewed
Geography
Western Washington, United States
System
Forest streams; salmonid habitat and restoration

WHAT THE EVIDENCE SAYS

From 2007–2024, investigators analyzed 4,421 habitat surveys from 269 sites across ten watersheds in three complexes, tracking wood, pools, gravel and channel geometry alongside varying restoration effort. Most expected whole-watershed directional shifts and treated-versus-reference differences did not emerge. Year-to-year and within-watershed variability were substantial.

WHY IT MATTERS / OUR READ

A single before-and-after snapshot cannot tell whether watershed restoration worked. Programs need repeated, spatially distributed measurements and a defined inference scale before investment can be assessed.

CAVEATS / UNCERTAINTY

Failure to detect a watershed-wide average habitat change is not proof that individual restoration projects had no local benefit or no salmon response. Some reference watersheds also experienced management; this paper assesses common habitat metrics, not every ecological objective.

SOURCE

Frontiers in Ecology and Evolution — primary long-term monitoring study
View original evidence ↗

Read the Wild Lands assessment

In western Rwanda, connected tree cover was not the same as connected biodiversity

Bird and woody-plant surveys at 91 sites favored connected traditional home gardens over connectivity dominated by exotic tree plantations.

Evidence
Peer-reviewed
Geography
Western Province, Rwanda
System
Afromontane forest mosaic; home gardens; agroforestry

WHAT THE EVIDENCE SAYS

Researchers used Omniscape circuit-theory connectivity surfaces for trees and home gardens and compared them with woody-plant and bird richness and diversity at 91 field sites. Connectivity dominated by exotic plantations was negatively associated with these biodiversity measures; home-garden connectivity was positively associated. The analysis supports gardens as complementary stepping stones.

WHY IT MATTERS / OUR READ

Counting additional trees can be a poor proxy for habitat that animals actually use. Landscape restoration should distinguish native-forest protection, planted-canopy extent and biodiversity-supporting matrix habitat.

CAVEATS / UNCERTAINTY

These are observational associations in one Rwandan region, not proof that creating any home garden will cause equivalent biodiversity gains. Gardens do not replace primary native forest or the habitat requirements of forest specialists.

SOURCE

Landscape Ecology — primary field and connectivity study
View original evidence ↗

Read the Wild Lands assessment

A roads meta-analysis found an average wildlife cost—and big uncertainty

A synthesis of 160 studies found a roughly 32% reduction on one effect scale, while other effect metrics were uncertain and site results varied greatly.

Evidence
Peer-reviewed
Geography
Studies spanning multiple world regions
System
Road corridors; terrestrial wildlife communities

WHAT THE EVIDENCE SAYS

Reviewers fitted three-level models to 643 effect estimates from 160 studies. On the log-response-ratio scale, wildlife outcomes near roads averaged about 32% lower, but the standardized mean difference and correlation estimates had confidence intervals crossing zero. Prediction intervals spanned positive and negative responses; traffic volume was reported for only 91 effects.

WHY IT MATTERS / OUR READ

An average road effect is not an adequate crossing-location or mitigation design. Species, outcome type, traffic exposure and nearby habitat all matter; mixed effect scales should not be silently collapsed into a single universal loss percentage.

CAVEATS / UNCERTAINTY

Effects were heterogeneous and most studies did not supply standardized traffic-volume information. This synthesis is observational across studies and does not prove a single causal road response for all taxa or habitats.

SOURCE

Frontiers in Ecology and Evolution — primary systematic review and meta-analysis
View original evidence ↗

Read the Wild Lands assessment

Global Radar

A wider field of view.

  1. Exotic axis deer appeared more behaviorally flexible than native brocket deer

    Camera traps in an Argentine protected area found more axis deer records and broader activity timing, but did not demonstrate competitive displacement.

    Evidence
    Peer-reviewed
    Geography
    Entre Ríos, Argentina
    System
    Espinal native and riparian forests; ungulate coexistence

    WHAT THE EVIDENCE SAYS

    From July 2022 to January 2024, camera traps at La Esmeralda documented higher relative detection of introduced Axis axis and broader activity times than native Subulo gouazoubira, which was more consistently crepuscular. Temporal overlap remained high; the researchers noted possible habitat competition rather than documenting it experimentally.

    WHY IT MATTERS / OUR READ

    Long-term invasion assessments need to track native species, productive-landscape exposure and time-of-day habitat use, not simply abundance of the newcomer.

    CAVEATS / UNCERTAINTY

    Only two camera stations served each habitat type at one protected area. Relative detections and modeled local densities are not regional population trajectories, and competition remains an inference.

    SOURCE

    Discover Life — primary camera-trap study
    View original evidence ↗

    Read the Wild Lands assessment
  2. Antarctic amphipods clustered where ocean currents met near Elephant Island

    A newly published analysis of 2018 sampling found concentrated Themisto amphipods in warmer current-influenced waters, with many juveniles.

    Evidence
    Peer-reviewed
    Geography
    South Shetland Islands and Elephant Island, Southern Ocean
    System
    Pelagic food webs; polar currents and zooplankton

    WHAT THE EVIDENCE SAYS

    Researchers examined 75 stations sampled during the 2018 Polarstern PS112 expedition and recorded 1,347 Themisto gaudichaudii. Abundance peaked near Elephant Island under the Antarctic Circumpolar Current's influence; the sample was juvenile-heavy, and body length was related to chlorophyll a but not significantly to temperature or salinity in the sampled range.

    WHY IT MATTERS / OUR READ

    Monitoring alternative prey in changing polar food webs needs attention to water masses, timing and life stages as well as species presence.

    CAVEATS / UNCERTAINTY

    These samples were from one March–May 2018 expedition, not a trend in abundance through 2026. No krill replacement or predator dietary switch was established.

    SOURCE

    Polar Biology — primary expedition-based field study
    View original evidence ↗

    Read the Wild Lands assessment
  3. In Himalayan coal-drainage streams, resistant diatoms tracked a mixture of chemical stresses

    Three mine-affected streams differed from a comparison stream in acidity, metals and ions; algal assemblages reflected their combined chemistry.

    Evidence
    Peer-reviewed
    Geography
    Jaintia Hills, Meghalaya, India
    System
    Acid mine drainage; stream diatoms

    WHAT THE EVIDENCE SAYS

    Seasonal sampling compared three mine-drainage-affected streams with one comparator. Impacted waters were more acidic and carried elevated metal and ionic signals. Species including Pinnularia biceps and Eunotia exigua showed associations with particular multi-variable chemical gradients, supporting a role as potential local bioindicators.

    WHY IT MATTERS / OUR READ

    Water-quality surveillance should pair chemical measurements with biological responses: survival of tolerant organisms does not establish healthy stream condition.

    CAVEATS / UNCERTAINTY

    Only three dominant diatom taxa and four streams were analyzed. Associations cannot isolate individual metal effects or establish a widely transferable index without testing.

    SOURCE

    Water Science — primary stream chemistry and algal study
    View original evidence ↗

    Read the Wild Lands assessment
  4. Taipei's river chemistry improved, but bacteria did not follow the same trajectory

    A 2010–2025 station record showed declines in several pollution metrics even as the coliform indicator rose between early and late survey windows.

    Evidence
    Peer-reviewed
    Geography
    Danshui River basin, metropolitan Taipei, Taiwan
    System
    Urban river; constructed wetlands; wastewater infrastructure

    WHAT THE EVIDENCE SAYS

    A non-parametric analysis of 1,921 monthly water samples from 11 stations found falling suspended solids at nine stations, ammonia at eight and five-day biochemical oxygen demand at six. Mean River Pollution Index fell from 3.83 to 3.20, but a coliform countertrend and uneven dissolved oxygen responses complicated the aggregate improvement story.

    WHY IT MATTERS / OUR READ

    Different pollutant classes call for different actions; a composite score or expanded sewer connection does not on its own certify ecological or sanitary recovery.

    CAVEATS / UNCERTAINTY

    Time trends and change points are not causal attribution to wetlands or sewer work. The incomplete 2026 record was excluded from early-versus-late comparisons.

    SOURCE

    Frontiers in Ecology and Evolution — primary long-term river-water analysis
    View original evidence ↗

    Read the Wild Lands assessment
  5. Great Lakes wetland plants yielded a more sensitive local disturbance index

    A 41,314-plot dataset underpins a plant-based index that improved within-lake discrimination of water-quality and land-use stress.

    Evidence
    Peer-reviewed
    Geography
    Five Laurentian Great Lakes, United States and Canada
    System
    Great Lakes coastal wetlands; biotic condition

    WHAT THE EVIDENCE SAYS

    Researchers used 41,314 vegetation quadrats from 563 coastal wetlands across twelve years to estimate lake-specific probabilities for plant occurrences under disturbance. The resulting plant-based Index of Biotic Condition tracked water-quality and surrounding land-use gradients at independent test sites and often outperformed traditional floristic-quality measures within each lake.

    WHY IT MATTERS / OUR READ

    Calibration to observed plant responses can make vegetation monitoring more informative than a single expert-assigned conservatism score.

    CAVEATS / UNCERTAINTY

    Lake-specific models and incomplete species weights require recalibration elsewhere. Predicting gradients in observed disturbance does not establish that the index detects every recovery trajectory.

    SOURCE

    Wetlands — primary multi-year wetland-index study
    View original evidence ↗

    Read the Wild Lands assessment
  6. One coastal resilience map was not enough for China’s local bays

    A national land-and-water index and a nested Rongcheng diagnosis differed in what they could resolve; scores measured capacity, not observed recovery.

    Evidence
    Peer-reviewed
    Geography
    Mainland China and Rongcheng, Shandong, China
    System
    Coastal social-ecological land–sea system

    WHAT THE EVIDENCE SAYS

    A three-tier, ten-attribute spatial framework combined nominal-2025 national indicators with a separately weighted local case study. National means were 0.359 for coastal land and 0.470 for coastal waters; more detailed Rongcheng maps exposed within-bay variability, including aquaculture-influenced areas.

    WHY IT MATTERS / OUR READ

    A national index can screen for places that need attention, but monitoring and management limits must be set at the scale of local ecological and institutional processes.

    CAVEATS / UNCERTAINTY

    These are model-derived composite capacity scores, not verified post-storm recovery or a causal test. National and local values cannot be compared directly because their indicators and weightings differ.

    SOURCE

    Frontiers in Ecology and Evolution — primary coastal index analysis
    View original evidence ↗

    Read the Wild Lands assessment
  7. Fire researchers linked airborne lasers, ground scans and field plots in one fuel dataset

    Nine southeastern pine, five western pine and four western grassland sites now have aligned 3-D fuel data to test fire-model inputs.

    Evidence
    Peer-reviewed
    Geography
    Southeastern and western United States
    System
    Wildland fuels; pine stands and grasslands

    WHAT THE EVIDENCE SAYS

    An integrated sampling program paired airborne LiDAR, terrestrial laser scans, structure-from-motion imagery and destructive fuel measurements at 18 sites. The co-located fuel objects and metrics are available in a research data repository for training and evaluating 3-D fire-behavior models.

    WHY IT MATTERS / OUR READ

    Structural mapping becomes more decision-useful when remote measurements are calibrated against actual fuel objects and concentrations on the ground.

    CAVEATS / UNCERTAINTY

    This paper describes a datasets-and-methods foundation, not proof that resulting fire forecasts are now accurate everywhere. Operational transfer requires model training and field checks.

    SOURCE

    Fire Ecology / USDA Forest Service — primary data-method paper
    View original evidence ↗

    Read the Wild Lands assessment
  8. Tropical forests' canopy-water buffer could weaken as atmospheric drying intensifies

    Observation-based modeling found water held in canopies moderated past declines in photosynthetic water-use efficiency, but that benefit declined in projections.

    Evidence
    Peer-reviewed
    Geography
    Pantropical forest regions
    System
    Tropical forest carbon–water interactions

    WHAT THE EVIDENCE SAYS

    Researchers integrated satellite, flux-site and climate-model products. Historical analysis for 2001–2015 suggested canopy water moderated ecosystem water-use-efficiency declines by about 18% under atmospheric aridity and 9% under soil drought; late-century simulations projected much weaker atmospheric buffering.

    WHY IT MATTERS / OUR READ

    Tree-cover persistence may mask diminishing physiological capacity, so ecological resilience assessments should connect canopy function and climate exposure.

    CAVEATS / UNCERTAINTY

    The late-century decline—including a projected 88% reduction in the modeled buffering function—is scenario- and model-dependent, not measured future dieback or a forest-by-forest forecast.

    SOURCE

    Water Resources Research — primary remote-sensing and scenario study
    View original evidence ↗

    Read the Wild Lands assessment
  9. Rare trees were missing from the youngest and oldest size classes in a Chinese watershed forest

    Thirty-six plots in a major water-diversion intake area found that rare woody species occupied a narrow structural window.

    Evidence
    Peer-reviewed
    Geography
    Nanyang, Henan, China
    System
    Temperate–subtropical transition forest; reservoir catchment

    WHAT THE EVIDENCE SAYS

    Surveys counted 2,210 woody stems belonging to 39 species in 36 permanent plots. Common species occupied most diameter and height classes, while rare woody taxa were largely clustered at intermediate sizes and absent from the largest classes, suggesting weak recruitment or progression.

    WHY IT MATTERS / OUR READ

    Presence on a species list is not the same as a viable age structure; conservation plans should look for regeneration and canopy progression.

    CAVEATS / UNCERTAINTY

    Diameter-class patterns are a snapshot, not followed individuals. Recruitment failure, competition and gap dependence need repeated plots before attributing causes.

    SOURCE

    Frontiers in Ecology and Evolution — primary forest plot study
    View original evidence ↗

    Read the Wild Lands assessment
  10. Arid streams in a rainfall gradient produced more secondary biomass than wetter ones

    Nine rivers tracked for three years shifted from detritivore-heavy food webs in wetter settings toward vertebrate herbivory in drier settings.

    Evidence
    Peer-reviewed
    Geography
    Nine rivers across a natural precipitation gradient
    System
    Freshwater food webs; riverine secondary production

    WHAT THE EVIDENCE SAYS

    Across nine rivers over three years, researchers compared invertebrate and vertebrate secondary production. Wetter streams had food-web energy concentrated in detritivorous invertebrates; arid streams showed more vertebrate herbivory and approximately twice the secondary production and biomass turnover.

    WHY IT MATTERS / OUR READ

    A changing rainfall regime can reorganize an aquatic food web even when the river still appears to flow; production depends on which trophic pathways carry energy.

    CAVEATS / UNCERTAINTY

    Site contrasts along a rainfall gradient are not a controlled climate-change experiment; geology, productivity and local biota may also differ. Reported production ratios are context-bound.

    SOURCE

    Ecology — primary comparative multi-river study
    View original evidence ↗

    Read the Wild Lands assessment

Landscape / City Watch

Cities are ecological systems.

US city density did not erase consumption's ecological footprint

An 83,603-census-tract analysis found slightly higher per-person ecological footprints in cities and near-linear scaling with urban population.

Evidence
Peer-reviewed
Geography
United States census tracts
System
Urban consumption; ecological footprint and spatial planning

WHAT THE EVIDENCE SAYS

Researchers estimated 2021 consumption across 52 categories in all 83,603 populated US census tracts. Per-capita ecological footprint was somewhat higher in urban tracts than suburban or rural ones; aggregate urban footprint scaled approximately linearly with population across alternative city boundaries.

WHY IT MATTERS / OUR READ

Planning debates should distinguish a city's direct spatial footprint from its indirect demand for land, materials, goods and services far outside city limits.

CAVEATS / UNCERTAINTY

Footprint estimates are model-based 2021 consumption accounting, not direct ecological condition or proof that density has no transport or habitat benefits. Average differences by settlement class were small and sensitive to definitions.

SOURCE

Nature Communications — primary urban consumption footprint analysis
View original evidence ↗

Read the Wild Lands assessment

October 14, 2026 · Issue 029

This morning’s strongest evidence asks us to separate a visible ecological state from the mechanism underneath it. Marsh stems in a severe wave-flume test bent rather than disappeared; almost two decades of stream-restoration monitoring showed year-to-year variation hiding expected watershed-wide changes; and Rwandan home gardens connected more birds and native woody plants than a landscape dominated by planted exotic tree cover. A worldwide road-effects synthesis likewise found an average wildlife cost that depends on the outcome and effect scale. Taken together, these are arguments for testing what actually functions, not just what a map, treatment label or headline number says.

Land Manager Watch

Evidence for decisions on land, water and habitat

Peer-reviewed · Dry ponderosa pine forests, Pacific Northwest United States

Frequent prescribed fire reduced shrub cover, but the wildlife-habitat tradeoff persisted

A long-term ponderosa-pine experiment found 5-year burns kept fuels and bitterbrush low, while 10- and 20-year regimes allowed different shrub and herb-layer outcomes.

Management read

Choose fire-return schedules from an explicit map of desired fuel, wildlife-forage and understory states rather than treating frequent burning as one universal prescription. A spatial mosaic of untreated patches and differently burned units may preserve habitat diversity while meeting fuels objectives.

Caveat / uncertainty: Results come from a particular long-term dry-forest experiment; fire severity, past stand structure, missed treatments and species composition matter. No fixed 5-, 10- or 20-year schedule is a site-independent recommendation.

Read the full evidence, caveats & Land Manager analysis →

Editorial thread to watch

Three mismatches run through this issue. First, a mapped or modeled capacity is not an observed outcome: coastal resilience indices, urban ecological footprints and 3-D fuel scans answer different questions from field performance. Second, ecological improvement is multidimensional: Taipei’s water chemistry improved while a microbial indicator did not, and rare Chinese forest species persisted without filling every growth stage. Third, restoration is a trajectory with tradeoffs: salmon streams need long monitoring horizons, prescribed-fire intervals shift wildlife forage and understory composition, and Rwanda’s gardens help without replacing native forest. Today’s Land Manager Watch follows the practical consequences of that last distinction.