Skip to content
Ecological Intelligence

Ecological evidence.
Independent perspective.
Explore Wild Lands ↗

Morning Brief Global edition

October 22, 2026 · Issue 037

A river can refill its food web in numbers while its species composition remains altered. Nine years after the Elwha dam removals, benthic abundance had largely rebounded from a major sediment pulse but community recovery ran behind it. At Belize's Carrie Bow Cay, one coral disease waned as another became prominent and reef structure thinned. Sumatra's forest remnants retained mammal habitat that nearby plantations lacked, while Austrian oxygen monitoring showed that a lake's seasonal story can be right even when its rate estimate depends on the sampling dates.

Land Manager Watch

Evidence for decisions on land, water and habitat

Peer-reviewed · Sacramento River floodplain, California, United States

A restored floodplain can regrow trees without regaining its original small-scale terrain

Sacramento River LiDAR observations show that vegetation heterogeneity and floodplain microtopography recover on different clocks.

Management read

For projects starting on graded or simplified floodplains, decide whether seedling establishment, canopy complexity or terrain heterogeneity is the actual goal. Where hydrology and permitting allow, build microtopographic variation into the initial design and monitor it alongside vegetation using repeatable terrain metrics.

Caveat / uncertainty: These are relationships within one dam-influenced river system, not a controlled test that creating bumps will guarantee better wildlife outcomes. A LiDAR proxy measures structure, not all biotic function; any earthwork must be checked against flood conveyance, native communities and site constraints.

Read the full evidence, caveats & Land Manager analysis →

Editorial thread to watch

Today's organizing question: what, precisely, came back—and what did our measuring instrument leave out? Elwha tells us abundance and assemblage are different recovery endpoints; Belize shows a changing disease regime inside a changing host community; peatland cameras expose the value of small structural refuges; and Lake Piburg reveals how sampling cadence determines which freshwater changes can be measured. Across land, water, cities and oceans, the Radar follows independent results that complicate easy promises: rewetting may trade soil carbon against methane, planted savannas may exchange specialist birds for other species, and marine DNA may persist after its producer is gone. The Land Manager Watch asks whether restored floodplains actually recover their missing terrain, not only tree cover.

Priority Reads

The evidence that deserves a closer look.

The Elwha's insects returned in number before their river community recovered
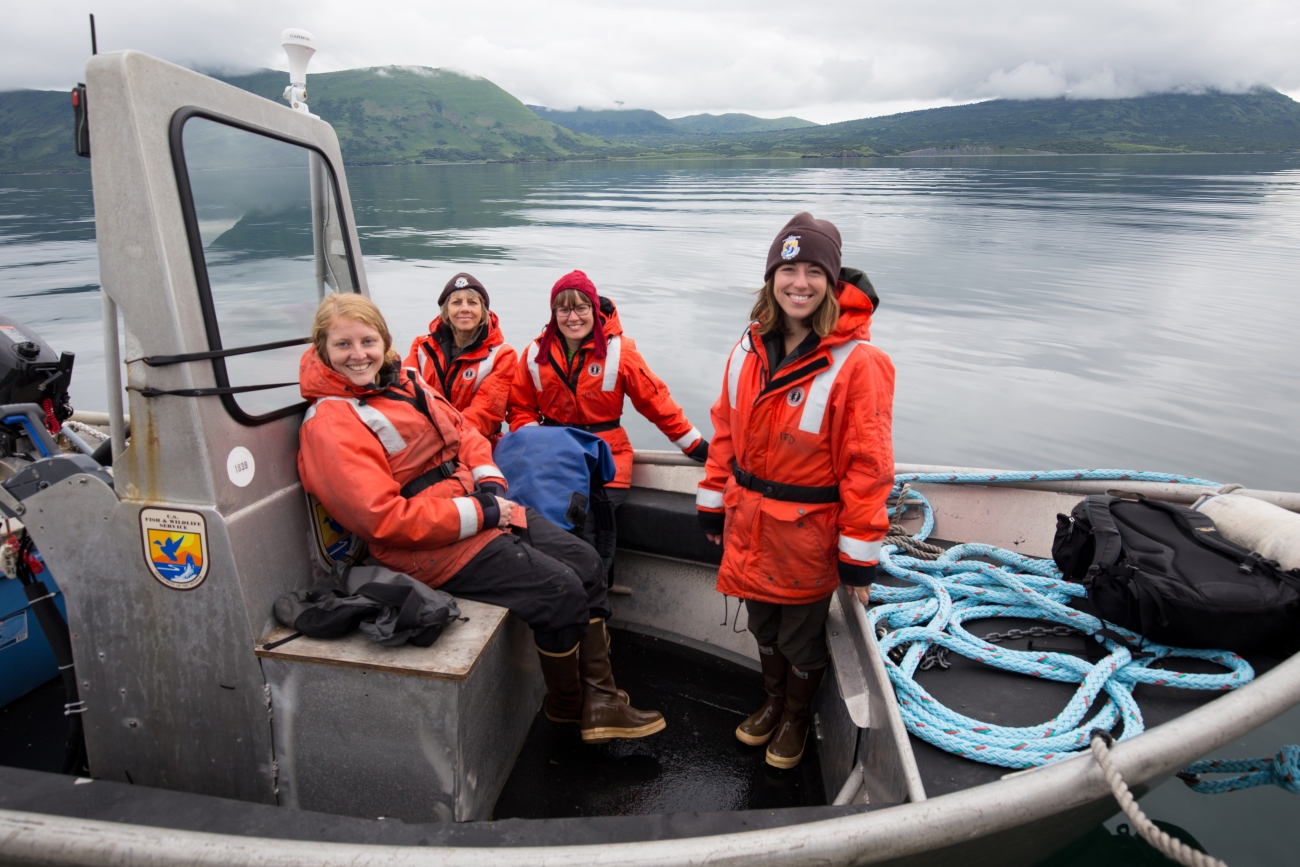
Lisa Hupp/USFWS — illustrative river-fieldwork photograph; not the Elwha River study site. · Public Domain (U.S. Fish & Wildlife Service; verified on source asset page) · Rights: Public domain

The Elwha's insects returned in number before their river community recovered

Nine years of monitoring after two large dam removals show that the rebound in insect abundance and the recovery of community composition are not the same milestone.

Evidence
Peer-reviewed
Geography
Elwha River, Washington, United States
System
River / dam removal / sediment disturbance

WHAT THE EVIDENCE SAYS

Following removal of the Elwha and Glines Canyon dams, more than 20 million tonnes of reservoir sediment moved downstream as passage reopened to more than 90% of the watershed. Across five river reaches and nine years of observations, benthic invertebrate density fell as much as 95% during active removal, then returned near baseline within roughly three years of peak sediment transport. Taxa richness and community composition, notably some caddisflies and longer-lived groups, remained altered after that interval.

WHY IT MATTERS / OUR READ

The ecological signature of a restoration project can contain immediate disturbance, recovery in one metric and prolonged change in another. Restoration success criteria should distinguish connectivity, organism numbers, sensitive taxa and community composition; the years after construction are part of the intervention, not an optional follow-up.

CAVEATS / UNCERTAINTY

Observational before-during-after monitoring was conducted in one very large dam-removal system, with fish recolonization, sediment and habitat succession interacting. A numerical rebound does not prove all functions or populations are restored; these outcomes do not imply dams should remain.

SOURCE

Frontiers in Ecology and Evolution — Morley et al. (2026)
View original evidence ↗

Read the Wild Lands assessment

Belize's reef disease shifted forms as the coral community thinned

Longitudinal Carrie Bow Cay surveys reveal multiple disease phases rather than a single outbreak-and-recovery curve.

Evidence
Peer-reviewed
Geography
Carrie Bow Cay, Belize Barrier Reef, Belize
System
Coral reef / disease ecology

WHAT THE EVIDENCE SAYS

Surveys beginning in 2019 found average coral disease prevalence of about 0.5%; following the spread of stony coral tissue loss disease it reached about 6.2% by 2022. By 2024 average prevalence was 4.2%, but chronic tissue-loss symptoms in Siderastrea siderea accounted for about 90% of diseased colonies. Across the study, coral colony density declined 73.4%, richness declined 33%, and sponge cover rose from 1.3% to 4.5%. The 2023 bleaching event added a distinct pressure.

WHY IT MATTERS / OUR READ

A falling prevalence of the first disease does not necessarily mean a reef is returning to its former composition. Monitoring that follows both disease identity and the surviving host community can detect a transition from one ecological state to another.

CAVEATS / UNCERTAINTY

Observations are concentrated around one monitored reef locality and associated surveys; different disease syndromes and heat stress co-occurred. Observational time series do not isolate a single causal contribution to every coral loss. The study does not establish future trajectories throughout the Caribbean.

SOURCE

Frontiers in Marine Science — Aeby et al. (2026)
View original evidence ↗

Read the Wild Lands assessment

Sumatra's narrow forest remnants held mammals plantations largely missed

A 723,637-hectare peatland landscape analysis finds meaningful habitat in linear forest remnants, while plantations support fewer detected mammal species.

Evidence
Peer-reviewed
Geography
Modified peat-swamp forest and Acacia plantations, Sumatra, Indonesia
System
Tropical peat forest / working landscape

WHAT THE EVIDENCE SAYS

Across 17,132 camera-trap days in a proposed nature-based-solutions landscape, researchers recorded 23 medium-to-large mammal species. They detected six species in young Acacia plantations, 11 in mature plantations, and 19 each in linear forest remnants and core forest. The team modeled habitat priorities for eight threatened or conservation-concern species and explored alternative landscape configurations under explicit scenario assumptions.

WHY IT MATTERS / OUR READ

Peatland management is not simply a choice between intact reserves and production plantations. Narrow remnants may carry disproportionate conservation value and provide a practical starting point for protecting habitat structure, while the modeled scenarios help frame decisions about corridors and land cover rather than proving future outcomes.

CAVEATS / UNCERTAINTY

Camera detection and modeled habitat suitability are not direct measures of abundance, population trends or realized restoration gains. The scenarios hold peat depth, roads and water features static; they are planning hypotheses in one Sumatran landscape, not field-tested forecasts of species recovery.

SOURCE

Journal of Applied Ecology — Pinondang et al. (2026)
View original evidence ↗

Read the Wild Lands assessment

Monthly lake measurements can track a season and still miss the rate of change

Three years of hourly sensors versus monthly water profiles show why observation frequency needs to match the oxygen question.

Evidence
Peer-reviewed
Geography
Lake Piburg, Tyrol, Austria
System
Freshwater lake / stratification / oxygen monitoring

WHAT THE EVIDENCE SAYS

In a small alpine lake, researchers compared 2022–2024 hourly dissolved-oxygen observations with roughly monthly profiles. Coarse measurements reproduced broad seasonal oxygen trajectories, but the estimated rate of deep-water oxygen depletion depended strongly on which sampling dates were chosen. Mean within-year ranges of signed rate error widened from 8.0 percentage points at seven-day subsampling to 47.5 at 30 days. Lower-oxygen day counts were correlated between methods, but unequal observation coverage made annual durations incomparable.

WHY IT MATTERS / OUR READ

A monitoring network cannot be judged by how much data it gathers without naming the decision it supports. Monthly surveys can remain useful for broad trends, while diagnosing hypoxia onset, depletion rate or short events may require a different temporal design.

CAVEATS / UNCERTAINTY

This comparison concerns one small, dimictic lake and combines independent instruments with different methods for some comparisons. It does not prescribe one universal sampling interval, and strongly correlated threshold counts should not be reported as unbiased annual durations.

SOURCE

Environmental Monitoring and Assessment — Weniger & Sommaruga (2026)
View original evidence ↗

Read the Wild Lands assessment

Global Radar

A wider field of view.

  1. Rewetting streams stored more soil carbon—and released more methane in one treatment

    A northern New Mexico comparison found different carbon and methane responses from plug-and-ponds and beaver dam analogs.

    Evidence
    Peer-reviewed
    Geography
    Northern New Mexico, United States
    System
    Riparian meadow / stream restoration / soil carbon

    WHAT THE EVIDENCE SAYS

    Researchers sampled riparian soils near reaches restored with plug-and-ponds or beaver dam analogs. After three years, particulate organic carbon at plug-and-pond sites increased from about 22.3 to 62.5 grams carbon per kilogram, while measured methane flux rose from about 0.14 to 1.73 micrograms carbon per square meter per second. Beaver dam analog sites did not show consistent carbon or moisture increases, perhaps in part because steeper slopes limited sustained wetting.

    WHY IT MATTERS / OUR READ

    Managers should budget for both intended soil processes and greenhouse-gas tradeoffs, and evaluate terrain before assuming methods with similar names produce similar hydrology.

    CAVEATS / UNCERTAINTY

    Preliminary calculations suggest the added methane did not outweigh soil-carbon benefits, but they are not a full life-cycle climate accounting. Observational sites differ in slope and restoration design, and soil-carbon fractions are not identical to durable whole-site sequestration.

    SOURCE

    Restoration Ecology / USDA Forest Service — Krichels et al. (2026)
    View original evidence ↗

    Read the Wild Lands assessment
  2. Dead logs hosted the richest slime-mold assemblages in one Araucaria forest

    A fine-scale Brazilian substrate survey argues for looking below the canopy when assessing forest biodiversity.

    Evidence
    Peer-reviewed
    Geography
    São Francisco de Paula National Forest, Rio Grande do Sul, Brazil
    System
    Araucaria forest / deadwood microhabitat

    WHAT THE EVIDENCE SAYS

    Sampling dead logs, branches, twigs, leaf litter and living plants at three locations yielded 160 slime-mold specimens in 30 taxa. Dead logs had the highest mean richness and abundance, and community composition differed among the five substrates. Two taxa were newly recorded for Rio Grande do Sul.

    WHY IT MATTERS / OUR READ

    A stand's biodiversity cannot be inferred from tree cover alone; decomposition substrates create important, distinct microhabitats worth noticing in habitat inventories.

    CAVEATS / UNCERTAINTY

    The team sampled just 15 units at three points and did not quantify how much of each substrate was available. Higher recorded richness on logs cannot be translated into an experimentally established habitat preference or generalized to all Araucaria forests.

    SOURCE

    Mycological Progress — Velloso et al. (2026)
    View original evidence ↗

    Read the Wild Lands assessment
  3. Charcoal-feeding fungi were not necessarily the most heat-tolerant

    Seven cultured fungal isolates from a fire-adapted system complicate the idea that all postfire traits travel together.

    Evidence
    Peer-reviewed
    Geography
    Longleaf-pine fire ecosystem, southeastern United States
    System
    Fire-adapted forest / soil fungal ecology

    WHAT THE EVIDENCE SAYS

    Researchers compared seven Trichoderma and Mucor isolates grown on pyrogenic carbon, sucrose and control substrates under different temperatures. Many could grow on fire-derived carbon, but evidence that charcoal use and heat tolerance were coordinated was weak. Growth strategies also varied substantially within species.

    WHY IT MATTERS / OUR READ

    Disturbance ecology needs to treat different microbial traits separately: persistence through heat, colonization after fire and decomposition of black carbon do not have to be the same adaptation.

    CAVEATS / UNCERTAINTY

    Laboratory growth of seven isolates is not a measurement of ecosystem-scale decomposition, soil carbon turnover or field postfire recovery. Traits may vary with substrate and environment, and the source is an accepted, early-layout manuscript.

    SOURCE

    Frontiers in Ecology and Evolution — Chung et al. (2026)
    View original evidence ↗

    Read the Wild Lands assessment
  4. Tiny field-edge strips changed where pollinator models placed habitat

    Dutch bee and hoverfly models improved when linear habitat elements were mapped instead of being averaged into cropland.

    Evidence
    Peer-reviewed
    Geography
    Three agricultural landscapes, Netherlands
    System
    Agricultural landscape / pollinator habitat

    WHAT THE EVIDENCE SAYS

    Fine-resolution (10-meter) species-distribution models incorporated herbaceous linear landscape elements as cover or distance covariates. Compared with models lacking these features, inclusion improved predictions and reduced overprediction in fields and underprediction at edges; improvements were evaluated against independently collected field records as well as withheld training data.

    WHY IT MATTERS / OUR READ

    Restoration opportunity maps need to capture narrow field margins and ditches, not just broad land-cover classes; independent field validation matters when models guide scarce conservation funds.

    CAVEATS / UNCERTAINTY

    Model improvement is not proof that newly adding a strip will cause equivalent abundance gains. Transferability from three Dutch landscapes to other crops, climates or taxa remains to be tested.

    SOURCE

    Landscape Ecology — Moens et al. (2026)
    View original evidence ↗

    Read the Wild Lands assessment
  5. Dongting Lake's habitat model did not neatly predict waterbird richness

    Landscape change and InVEST habitat scores moved, but some direct waterbird-richness associations remained weak.

    Evidence
    Peer-reviewed
    Geography
    Dongting Lake, Hunan Province, China
    System
    Floodplain lake / migratory waterbird habitat

    WHAT THE EVIDENCE SAYS

    An analysis of wetland classes from 2000–2020 found total wetland area grew modestly, while lake area contracted and marshes and ponds expanded. Mean modeled habitat-quality scores declined, and modeled degradation increased. Waterbird richness had generally weak associations with these scores; wetland largest-patch index related significantly to community composition in one recession period, not uniformly to richness.

    WHY IT MATTERS / OUR READ

    A map that signals habitat quality is a testable hypothesis, not a substitute for season-specific counts and assemblage data. Wetland reconfiguration may change which birds occupy a landscape even when aggregate area appears stable.

    CAVEATS / UNCERTAINTY

    InVEST scores are modeled proxies and bird associations vary with recession phase. Weak or nonsignificant richness signals should not be presented as null ecological impacts or causal effects of the mapped change.

    SOURCE

    Frontiers in Ecology and Evolution — Xu et al. (2026)
    View original evidence ↗

    Read the Wild Lands assessment
  6. Planting trees in old savanna changed which birds remained, not always how many

    Across a Maharashtra rainfall gradient, plantations shifted specialist communities even when total richness did not change overall.

    Evidence
    Peer-reviewed
    Geography
    Western Maharashtra, India
    System
    Tropical savanna / afforestation / birds

    WHAT THE EVIDENCE SAYS

    Birds were counted at 15 paired old-growth savanna and exotic tree plantation sites spanning 459–1007 millimeters of annual rainfall. Averaged across sites, afforestation did not significantly alter total richness or abundance. But the composition shifted: savanna specialists declined, woodland specialists increased, and richness responses differed at the wetter, drier and intermediate ends of the rainfall range.

    WHY IT MATTERS / OUR READ

    Counting more trees or even retaining an aggregate species total is not equivalent to conserving the original open-habitat community. Management should identify which ecosystem and species groups its planting goal is intended to serve.

    CAVEATS / UNCERTAINTY

    The paired-site comparison is observational and confined to one Indian region and tree-plantation context. It does not imply all native-tree restoration or all agroforestry has the same effect.

    SOURCE

    Conservation Science and Practice — Mhetre et al. (2026)
    View original evidence ↗

    Read the Wild Lands assessment
  7. A Tanzanian conservation assessment tested who gets to choose success measures

    A protocol for selecting indicators combines ecological goals, project strategy and stakeholder judgments.

    Evidence
    Peer-reviewed
    Geography
    Magombera Conservation Area, Tanzania
    System
    Conservation governance / monitoring design

    WHAT THE EVIDENCE SAYS

    Researchers piloted a Holistic Indicator Selection Protocol in the Magombera forest mosaic. The approach scored conservation-monitoring candidates using threats, a project's causal situation model, professional judgment and priorities expressed through local village committees. Different weighting schemes made visible the choices embedded in what would otherwise be presented as a neutral indicator set.

    WHY IT MATTERS / OUR READ

    The scientific question is not only whether an indicator is measurable, but whether it represents a conservation mechanism and matters to affected people. Explicitly comparing expert and community priorities can expose blind spots before project evaluation begins.

    CAVEATS / UNCERTAINTY

    This is a protocol and one implementation case, not an experimental demonstration of improved conservation outcomes. The chosen weights and representation processes remain judgment-laden and require transparent governance.

    SOURCE

    Conservation Science and Practice — Marshall et al. (2026)
    View original evidence ↗

    Read the Wild Lands assessment
  8. Scottish aquaculture sites faced very different heatwave trajectories

    A satellite and farm-data analysis finds that increases in marine heatwave duration and severity were spatially uneven.

    Evidence
    Peer-reviewed
    Geography
    Scotland's finfish and shellfish farm locations, United Kingdom
    System
    Coastal ocean / aquaculture climate exposure

    WHAT THE EVIDENCE SAYS

    Researchers sampled 1990–2025 daily satellite sea-surface temperatures at 361 farm locations represented by 218 grid cells, with in-situ checks at eight farms. Comparing 1990–2019 with 2020–2025, the two exposure groups showed estimated event-duration increases of 44.6% and 89.9%. Severe-or-extreme event probabilities increased far more steeply in one group, even as mean event intensity changed comparatively little.

    WHY IT MATTERS / OUR READ

    Regional warming maps can hide site-level risk profiles. Monitoring and adaptation decisions should distinguish heatwave frequency, persistence, cumulative heat and uncertainty at operating sites.

    CAVEATS / UNCERTAINTY

    Five-kilometer satellite data do not capture all farm-depth thermal exposures, and this is a hazard assessment, not measured mortality or economic loss at farms. The analysis is an accepted early-layout peer-reviewed article.

    SOURCE

    Frontiers in Marine Science — Toledo-Jaime et al. (2026)
    View original evidence ↗

    Read the Wild Lands assessment
  9. Korean fish larvae mapped a more varied summer than winter

    A standardized national coastal survey found sharply different larval assemblages across seasons and marine regions.

    Evidence
    Peer-reviewed
    Geography
    Yellow Sea, Korea Strait, East Sea and Jeju waters, South Korea
    System
    Coastal fish / spawning and larval ecology

    WHAT THE EVIDENCE SAYS

    Across February and July 2017 net surveys at roughly 130 stations per season, researchers identified 61 larval taxa in February and 154 in July, with corresponding changes in eggs and region-specific assemblages. Japanese sand lance dominated February larvae, while Japanese anchovy was conspicuous in July. DNA barcoding complemented morphology for selected specimens.

    WHY IT MATTERS / OUR READ

    Fishery recruitment planning depends on sampling when and where larvae are actually present. A seasonal survey design that samples only one time of year may substantially miss the assemblage it purports to characterize.

    CAVEATS / UNCERTAINTY

    Only two months in one year were observed, so the results cannot establish year-to-year shifts, phenology trends or full seasonal peaks. Species-specific spawning and environmental variation are possible contributors, not independently manipulated causes.

    SOURCE

    Frontiers in Marine Science — Ji et al. (2026)
    View original evidence ↗

    Read the Wild Lands assessment
  10. Sediment DNA can outlast the animal a survey hopes to find

    A burrowing-decápod tank experiment detected persistent sedimentary DNA weeks after removal.

    Evidence
    Peer-reviewed
    Geography
    East Asian tidal-flat benthos studied in laboratory tanks, Japan
    System
    Intertidal seafloor / environmental DNA monitoring

    WHAT THE EVIDENCE SAYS

    Using burrowing shrimp Upogebia major, researchers followed DNA in sediments after animals were removed. Under the experimental tank conditions, target DNA persisted for at least 30 and up to 50 days without a clear sustained concentration drop, although values varied by sample position and day.

    WHY IT MATTERS / OUR READ

    A positive benthic eDNA detection can sometimes mean recent occupancy rather than present occupancy. Survey plans for cryptic burrowers need time-aware sampling, species-specific persistence estimates and independent confirmation when immediate presence matters.

    CAVEATS / UNCERTAINTY

    A tank is not a tidal flat: sediment disturbance, microbial communities and physical export may differ greatly outdoors. Persistence of this one species' DNA is not a general residence time for every marine taxon.

    SOURCE

    Frontiers in Marine Science — Kitabatake et al. (2026)
    View original evidence ↗

    Read the Wild Lands assessment

Landscape / City Watch

Cities are ecological systems.

Rome's river was a corridor for some dispersers and a barrier for others

Urban connectivity models suggest that no single green-link map represents all wildlife movement.

Evidence
Peer-reviewed
Geography
Rome metropolitan region, Italy
System
Urban protected areas / corridor modeling

WHAT THE EVIDENCE SAYS

Researchers modeled protected-area connectivity with circuit and graph theory under nine resistance scenarios representing three dispersal modes. The western and peripheral city sectors were generally more permeable than the center and east. The Tiber River appeared as either connective space or resistance depending on the assumed species' movement strategy. Shared candidate links often followed rivers and urban green spaces.

WHY IT MATTERS / OUR READ

Urban landscape plans should test which animals can actually cross a proposed corridor; a riverbank or park is not universally connected simply because it is green in an aerial image.

CAVEATS / UNCERTAINTY

Results are based on modeled resistance and dispersal assumptions, not observed migration or survival. Rome's urban form and species assemblages limit direct transfer of the identified corridor locations to other cities.

SOURCE

Landscape Ecology — Russo et al. (2026)
View original evidence ↗

Read the Wild Lands assessment

October 22, 2026 · Issue 037

A river can refill its food web in numbers while its species composition remains altered. Nine years after the Elwha dam removals, benthic abundance had largely rebounded from a major sediment pulse but community recovery ran behind it. At Belize's Carrie Bow Cay, one coral disease waned as another became prominent and reef structure thinned. Sumatra's forest remnants retained mammal habitat that nearby plantations lacked, while Austrian oxygen monitoring showed that a lake's seasonal story can be right even when its rate estimate depends on the sampling dates.

Land Manager Watch

Evidence for decisions on land, water and habitat

Peer-reviewed · Sacramento River floodplain, California, United States

A restored floodplain can regrow trees without regaining its original small-scale terrain

Sacramento River LiDAR observations show that vegetation heterogeneity and floodplain microtopography recover on different clocks.

Management read

For projects starting on graded or simplified floodplains, decide whether seedling establishment, canopy complexity or terrain heterogeneity is the actual goal. Where hydrology and permitting allow, build microtopographic variation into the initial design and monitor it alongside vegetation using repeatable terrain metrics.

Caveat / uncertainty: These are relationships within one dam-influenced river system, not a controlled test that creating bumps will guarantee better wildlife outcomes. A LiDAR proxy measures structure, not all biotic function; any earthwork must be checked against flood conveyance, native communities and site constraints.

Read the full evidence, caveats & Land Manager analysis →

Editorial thread to watch

Today's organizing question: what, precisely, came back—and what did our measuring instrument leave out? Elwha tells us abundance and assemblage are different recovery endpoints; Belize shows a changing disease regime inside a changing host community; peatland cameras expose the value of small structural refuges; and Lake Piburg reveals how sampling cadence determines which freshwater changes can be measured. Across land, water, cities and oceans, the Radar follows independent results that complicate easy promises: rewetting may trade soil carbon against methane, planted savannas may exchange specialist birds for other species, and marine DNA may persist after its producer is gone. The Land Manager Watch asks whether restored floodplains actually recover their missing terrain, not only tree cover.