Skip to content
Ecological Intelligence

Ecological evidence.
Independent perspective.
Explore Wild Lands ↗

Morning Brief Global edition

October 24, 2026 · Issue 039

The headline this morning is not simply that ecosystems are threatened; it is that measurements change meaning when we ignore place, pathway and denominator. In northern Alaska, most sampled fish showed little PFAS contamination, yet one industrial-adjacent location recorded a very different exposure signal. A new IUCN assessment says 96% of shallow-water reef ecoregions are at critical risk under projected warming—not that 96% have collapsed today. Hungary's lake system shows why shipping corridors, thermal waters and fishponds can each deliver a different invasion history. And China's blue-carbon programs reveal how an ecological estimate becomes credible only when the institutions bearing its long-term uncertainty are actually built. Today's Radar moves from modified deltas and African working lands to overlooked Brazilian microhabitats, Antarctic zooplankton, root-monitoring methods and deep Gulf food webs. The Counter-signal asks what an aquaculture efficiency claim means when the denominator changes; Land Manager Watch asks what indicator can genuinely reveal invasion outcomes.

Land Manager Watch

Evidence for decisions on land, water and habitat

Peer-reviewed observational invaded–uninvaded plot comparison · Lower Silesian Forests, southwestern Poland

An invasive shrub changed a wet meadow's soil-fauna story—but not simply its mite count

Matched plots in Poland complicate how monitoring evaluates plant invasions.

Management read

For wet-meadow invasion assessments, define multiple response metrics—plant dominance, litter chemistry, mite assemblage and recovery trajectory—and use paired reference plots rather than a single soil-fauna abundance total. No removal prescription follows from this study alone.

Caveat / uncertainty: Observational correlations cannot isolate shrub effects from pre-existing soils and seasonal differences; the article's diversity results vary by metric and some post-hoc comparisons are null. No shrub removal or habitat restoration treatment was tested.

Read the full evidence, caveats & Land Manager analysis →

Editorial thread to watch

Across these studies the same trap recurs: a spatial average masks a local contaminant exception, a threatened category becomes mistaken for present collapse, a canal is credited with effects that materialize through later human traffic, and an offset standard is mistaken for successful stewardship. Production ecology offers a parallel warning: yield per meter of rope and yield per meter of seeded twine can move in opposite directions. Monitoring should therefore specify whose outcome matters, the timescale, the measure and the uncertainty before a map or headline is treated as a decision. Place, method, governance and actual implementation remain inseparable.

Priority Reads

The evidence that deserves a closer look.

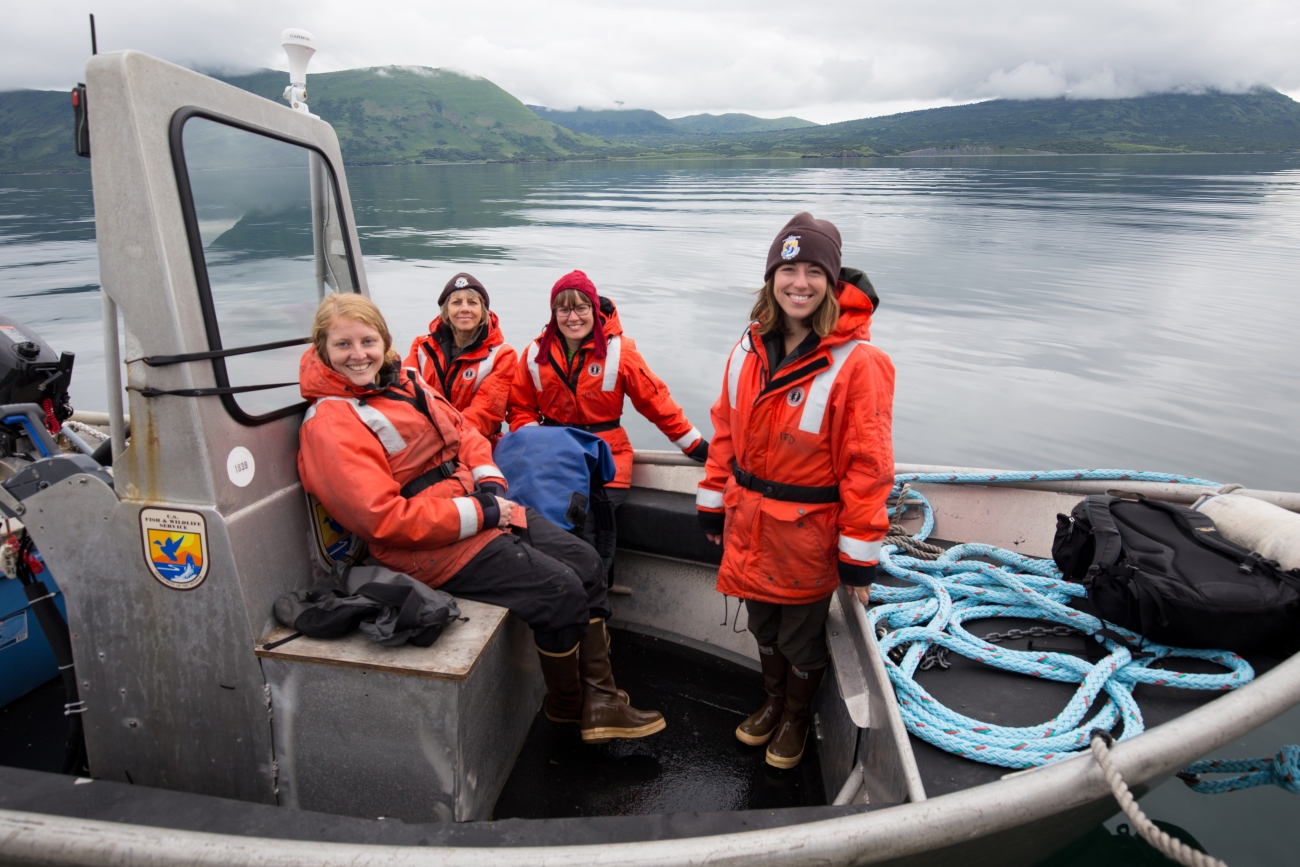
A mostly clean Arctic fish survey found one PFAS hotspot that changes the monitoring question
Lisa Hupp/USFWS — illustrative river field biology in Alaska; not the Brooks Range study site. · Public Domain (U.S. Fish & Wildlife Service; verified on source asset page) · Rights: Public domain

A mostly clean Arctic fish survey found one PFAS hotspot that changes the monitoring question

Brooks Range sampling found widespread low contamination but a conspicuous industrial-adjacent exception.

Evidence
Peer-reviewed field contaminant survey
Geography
Brooks Range and Dalton Highway corridor, Alaska
System
Arctic freshwater rivers and lakes

WHAT THE EVIDENCE SAYS

Fraley and colleagues measured metals and PFAS across aquatic media and fish in northern Alaska. Most fish contained no or trace PFAS, while samples near the Tea Lake outlet recorded PFOS as high as 40 µg/kg in a composite Arctic grayling sample; some large predatory fish also exceeded mercury consumption-advice thresholds.

WHY IT MATTERS / OUR READ

A landscape-wide average could conceal a localized exposure route with major implications for subsistence users. An appropriate next step is site-specific repeat testing, community engagement and appropriate agency assessment, not a blanket claim that northern waters are either safe or contaminated.

CAVEATS / UNCERTAINTY

Observational, spatially selective sampling; limited samples at individual sites. The study does not prove the source of Tea Lake PFOS or establish universal dietary advice. Comparisons use thresholds from multiple jurisdictions.

SOURCE

Environmental Monitoring and Assessment — Fraley et al. (2026)
View original evidence ↗

Read the Wild Lands assessment

Why 96% of reef ecoregions are rated critically endangered—and why that is not 96% collapse

The IUCN's first global reef ecosystem Red List separates observed damage from modeled future warming risk.

Evidence
IUCN Red List of Ecosystems assessment
Geography
127 shallow-water coral-reef ecoregions worldwide
System
Tropical and subtropical coral reefs

WHAT THE EVIDENCE SAYS

A 22 October IUCN assessment classified 122 of 127 assessed ecoregions (96%) Critically Endangered under an integrated analysis that includes future heat-stress projections. Using observed change alone, 116 (91%) were threatened and 30 (24%) Critically Endangered; one western Galápagos ecosystem was assessed Collapsed and four data deficient.

WHY IT MATTERS / OUR READ

The decision-relevant headline is the narrowing recovery interval under repeated marine heatwaves, not a claim that all assessed reefs have already stopped functioning. Monitoring must separate present ecological structure, function and projected collapse risk.

CAVEATS / UNCERTAINTY

Risk categories are not observed collapse. The 96% designation is sensitive to the future-climate scenario (SSP2-4.5) and assessment criteria; ecosystem-level results differ from species-level coral Red List findings.

SOURCE

IUCN Red List of Ecosystems — Global Coral Reef Assessment (22 Oct 2026)
View original evidence ↗

Read the Wild Lands assessment

An invasive-species map changes when one watershed has several gateways

Lake Balaton, a thermal lake and fishponds tell distinct histories of non-native aquatic species.

Evidence
Peer-reviewed historical catchment reconstruction
Geography
Lake Balaton and Lake Hévíz catchment, Hungary
System
Freshwater lake, thermal lake, fishponds and tributaries

WHAT THE EVIDENCE SAYS

Schmera and colleagues catalogued 93 non-native aquatic taxa across a heterogeneous freshwater catchment. Lake Hévíz accounted for 45 first records, Balaton for 37, and fishponds for six. The 1863 canal opening did not yield an immediate jump in introductions; pathways involved shipping, aquarium releases and fish production with substantial time lags.

WHY IT MATTERS / OUR READ

Treat a watershed as interacting introduction networks, not one uniform invasion front. Prevention and monitoring priorities should differ at navigation corridors, ornamental-release hotspots and aquaculture facilities.

CAVEATS / UNCERTAINTY

Historical first detections are subject to unequal survey effort and reporting delay; not all 93 taxa are confirmed presently established. Opening a canal alone cannot be isolated causally from later shipping activity.

SOURCE

Hydrobiologia — Schmera et al. (2026)
View original evidence ↗

Read the Wild Lands assessment

Blue carbon credits depend on institutions as much as sediment

Chinese programs show the gap between measuring a carbon sink and sustaining a credible commitment.

Evidence
Peer-reviewed policy-document analysis and expert interviews
Geography
Coastal China
System
Coastal blue-carbon ecosystems and MRV institutions

WHAT THE EVIDENCE SAYS

Zhang compared Chinese national/local policy documents, carbon accounting standards and 12 expert interviews. The research identifies tensions among baselines, MRV, registries, liability and risk-sharing as local pilot programs try to operationalize national blue-carbon ambitions.

WHY IT MATTERS / OUR READ

A carbon estimate is an input to a governance system, not proof of a durable environmental outcome. Credible project design requires monitoring standards, accountable institutions, financial continuity and a fair division of long-horizon risk.

CAVEATS / UNCERTAINTY

This purposive qualitative study did not measure realized carbon sequestration or independently test offset additionality; 12 experts cannot represent all fishers, local communities or projects.

SOURCE

Regional Environmental Change — Zhang (2026)
View original evidence ↗

Read the Wild Lands assessment

Global Radar

A wider field of view.

  1. A California delta is powered by invasive plants as well as river carbon

    Eleven years of oxygen records expose linked carbon pathways in a heavily modified estuary.

    Evidence
    Peer-reviewed long-term aquatic metabolism analysis
    Geography
    Sacramento–San Joaquin Delta, California
    System
    Modified freshwater delta and estuary

    WHAT THE EVIDENCE SAYS

    High-frequency dissolved oxygen at six sites over 2014–2025 revealed heterotrophy in outer channels, internal production in invasive-plant-dominated central reaches, and decreased metabolism when a drought flow barrier isolated channels. Wastewater treatment upgrades produced negligible detected metabolic changes.

    WHY IT MATTERS / OUR READ

    Controlling water movement can change carbon transport even when a local water-quality improvement appears ecologically quiet; estuary management needs whole-delta flow and biological context.

    CAVEATS / UNCERTAINTY

    Oxygen-based metabolism integrates multiple organic-carbon pools; correlations around flow barriers are context-specific and not direct whole-ecosystem restoration outcomes.

    SOURCE

    Estuaries and Coasts — Volaric et al. (2026)
    View original evidence ↗

    Read the Wild Lands assessment
  2. Tanzanian beekeepers already know the flora; the bottleneck is farther down the chain

    Meru District respondents linked floral resources to quality while identifying training and marketing gaps.

    Evidence
    Peer-reviewed mixed-methods survey
    Geography
    Meru District, Tanzania
    System
    Agroforestry, bee-flora resources and working lands

    WHAT THE EVIDENCE SAYS

    A survey of 240 beekeepers and key informants found 97.9% could recognize bee flora, with 24 plants named; traditional hives and limited post-harvest labeling or formal training persisted. The work separates ecological knowledge from market conditions needed for value realization.

    WHY IT MATTERS / OUR READ

    Successful pollinator-linked livelihoods require forage continuity and accessible support, processing and markets; knowledge alone is not the barrier.

    CAVEATS / UNCERTAINTY

    Survey and self-reported practices do not establish measured honey quality, pollinator population effects or causal impacts of training.

    SOURCE

    Discover Environment — Mulokozi et al. (2026)
    View original evidence ↗

    Read the Wild Lands assessment
  3. Different soil-mapping methods change how much land looks critically acidic

    An Upper Blue Nile field and Sentinel-2 study makes interpolation uncertainty a management concern.

    Evidence
    Peer-reviewed field soil survey and spatial modeling
    Geography
    Gozamen District, Upper Blue Nile Basin, Ethiopia
    System
    Agricultural soils, grazing lands and forest

    WHAT THE EVIDENCE SAYS

    Soil samples from six Ethiopian kebeles and satellite land-cover classification found pH from 4.11 to 6.58. A mapped 43% very strongly acidic and 39% strongly acidic was method-dependent; cultivated and grazed areas tended to have more acidic soils than forests.

    WHY IT MATTERS / OUR READ

    Where lime, soil amendments or restoration budgets depend on a map, test and disclose the interpolation method; use field samples to validate project-scale prescriptions.

    CAVEATS / UNCERTAINTY

    Study area is limited to six kebeles; interpolation techniques shifted mapped class extents. Differences by land use do not alone prove vegetation causes pH change.

    SOURCE

    Discover Soil — Abate et al. (2026)
    View original evidence ↗

    Read the Wild Lands assessment
  4. Bromeliad pools shared most microbes but differed in predicted jobs

    Two co-occurring Brazilian plants reveal within-habitat diversity hidden by a single microbial list.

    Evidence
    Peer-reviewed microbial sequencing study
    Geography
    Serra da Piedade, Minas Gerais, Brazil
    System
    Ferruginous campo rupestre grassland and bromeliad water tanks

    WHAT THE EVIDENCE SAYS

    Sequencing water-filled leaves of Aechmea nudicaulis and Vriesea minarum found about 80.3% shared microbial genera but significant composition and predicted pathway differences associated with distinct water chemistry.

    WHY IT MATTERS / OUR READ

    Small plant-held waters are ecological microhabitats; ecosystem inventories that ignore host identity may miss functional heterogeneity.

    CAVEATS / UNCERTAINTY

    16S amplicon data and PICRUSt pathways predict functional potential; the study did not demonstrate in situ nutrient cycling or host fitness benefits.

    SOURCE

    Symbiosis — dos Santos et al. (2026)
    View original evidence ↗

    Read the Wild Lands assessment
  5. A Brazilian sinkhole yielded two previously undescribed aquatic beetles

    Yearlong sampling of a single karst pool broadened the known habitats of riffle beetles.

    Evidence
    Peer-reviewed taxonomic field study
    Geography
    Lagoa Misteriosa, Mato Grosso do Sul, Brazil
    System
    Karst sinkhole lake and aquatic macrophytes

    WHAT THE EVIDENCE SAYS

    Researchers described Microcylloepus dimorphus and Hexacylloepus misteriosa from adults and larvae sampled from macrophytes in Lagoa Misteriosa. These represent the first Brazilian riffle-beetle species described from a still-water habitat.

    WHY IT MATTERS / OUR READ

    Surveying unusual, apparently isolated microhabitats can change species-range and habitat assumptions even in well-studied taxonomic families.

    CAVEATS / UNCERTAINTY

    One sinkhole and one year of targeted collection; taxonomic discovery does not quantify regional abundance or endangerment.

    SOURCE

    Neotropical Entomology — Polizei et al. (2026)
    View original evidence ↗

    Read the Wild Lands assessment
  6. Antarctic pteropod size tracked water conditions—not a demonstrated warming response

    Ross Sea shell measurements offer an exploratory baseline for pelagic food-web monitoring.

    Evidence
    Peer-reviewed field morphometrics and exploratory modeling
    Geography
    Ross Sea and Terra Nova Bay, Antarctica
    System
    Southern Ocean pelagic pteropods

    WHAT THE EVIDENCE SAYS

    Grillo and colleagues measured 72 Limacina rangii specimens from the austral summer 2017 expedition. Random-forest analysis linked size variation most strongly with temperature, longitude and conductivity, with offshore larval prevalence.

    WHY IT MATTERS / OUR READ

    Adding body-size distributions to abundance records may improve detection of ecological change in a small but important calcifying prey group.

    CAVEATS / UNCERTAINTY

    One cruise and a non-random biometric subset; modeled correlations do not measure temporal climate trends or direct thermal causation.

    SOURCE

    Polar Biology — Grillo et al. (2026)
    View original evidence ↗

    Read the Wild Lands assessment
  7. An automated root-fungus detector needed field-trained categories

    MycorrhizaFinder addresses a laboratory-to-field transfer problem in ecological AI.

    Evidence
    Peer-reviewed method validation
    Geography
    Field-collected root systems; developed in the United Kingdom
    System
    Mycorrhizal soil-root associations and monitoring

    WHAT THE EVIDENCE SAYS

    A team testing automated root microscopy found that AMFinder struggled to distinguish complex field-stained roots. MycorrhizaFinder added classes and confidence-based human validation, improving detection of arbuscular and other mycorrhizal structures.

    WHY IT MATTERS / OUR READ

    Automated environmental measurement needs representative training material and human checks for underrepresented classes, not just a high aggregate accuracy.

    CAVEATS / UNCERTAINTY

    Accuracy varies by fungal type and training representation; high class accuracy can hide poor precision on uncommon categories. Method not yet a universal field standard.

    SOURCE

    Mycorrhiza — Kowal et al. (2026)
    View original evidence ↗

    Read the Wild Lands assessment
  8. A landfill-fire plume may need more than the usual benzo[a]pyrene test

    Polish fire-residue chemistry distinguished direct contact hazard from modeled water mobility.

    Evidence
    Peer-reviewed residue chemistry and risk modeling
    Geography
    Furniture-waste landfill fire, Poland
    System
    Post-industrial soil contamination and groundwater risk

    WHAT THE EVIDENCE SAYS

    Analysis of 13 post-fire residue samples identified multiple parent and alkylated PAHs; benzo[a]pyrene drove modeled direct-contact carcinogenic risk while more mobile fluoranthene drove modeled groundwater concern.

    WHY IT MATTERS / OUR READ

    Remediation and sampling plans need exposure-route-specific indicator compounds; one pollutant can be an inadequate proxy for all ecological pathways.

    CAVEATS / UNCERTAINTY

    Risk estimates modeled mobility and exposure; direct groundwater contamination, population impacts and remediation performance were not field-measured.

    SOURCE

    Environmental Geochemistry and Health — Rykała et al. (2026)
    View original evidence ↗

    Read the Wild Lands assessment
  9. A major restoration program lifted modeled household resilience unevenly

    China household-panel analysis found a modest association stronger among families with greater assets.

    Evidence
    Peer-reviewed quasi-experimental policy evaluation
    Geography
    Shan-Shui ecological restoration project regions, China
    System
    Working lands, restoration policy and rural livelihoods

    WHAT THE EVIDENCE SAYS

    Yang and colleagues linked 76,443 household-year observations to staggered Shan-Shui project exposure. Their adjusted difference-in-differences estimate was 0.161 on a resilience index, about 2.7% of the mean, with reported robustness checks and unequal effects across household circumstances.

    WHY IT MATTERS / OUR READ

    Ecological restoration can produce social benefits without distributing them equally; ownership, connectivity and capacity affect who can convert new resources into durable livelihoods.

    CAVEATS / UNCERTAINTY

    Administrative project exposure is coarse and the resilience index embeds economic measures; this does not separately verify site-level ecological recovery or rule out all confounding.

    SOURCE

    Frontiers in Sustainable Food Systems — Yang et al. (2026)
    View original evidence ↗

    Read the Wild Lands assessment
  10. The Gulf's deep-water prey community fell sharply—and the cause remains an inference

    Independent trawl, acoustic and genetic signals point to sustained declines in a hard-to-see food web.

    Evidence
    Peer-reviewed long-term ecological monitoring study
    Geography
    Northern Gulf of Mexico / Gulf of America
    System
    Deep-pelagic ocean food web

    WHAT THE EVIDENCE SAYS

    Sutton and colleagues reported 60–85% declines for multiple deep-pelagic animal groups after early-2010s baselines, with acoustic data and lanternfish genetic measures supporting the pattern. The study was published online 19 October 2026.

    WHY IT MATTERS / OUR READ

    Recovery monitoring should include prey communities and deep-ocean habitats, not just charismatic megafauna and surface ecosystems.

    CAVEATS / UNCERTAINTY

    Timing after Deepwater Horizon and lack of correlation with several natural drivers support—but cannot prove—a spill mechanism; baseline and observational design limit causal attribution.

    SOURCE

    PNAS — Sutton et al. (2026)
    View original evidence ↗

    Read the Wild Lands assessment

Landscape / City Watch

Cities are ecological systems.

American cities did not all run hotter than nature around them

Across 52 city pairs, the urban greenness and heat signature reversed between dry and wetter climates.

Evidence
Peer-reviewed multi-city Landsat observational analysis
Geography
52 city–reference pairs across the conterminous United States
System
Urban vegetation, land surface temperature and regional hydroclimate

WHAT THE EVIDENCE SAYS

Kucera and colleagues analyzed Landsat greenness and surface temperature in fixed urban footprints and nearby natural references, 1995–2024. Median cities were 0.17 NDVI units less green and 5.09°C warmer, but arid cities were often greener and cooler; annual-composite cities warmed about 22% faster on average than reference areas.

WHY IT MATTERS / OUR READ

Urban tree strategy is a landscape-water-balance question, not a uniform national cooling template; assess local reference ecology, irrigation demand and measured surface conditions.

CAVEATS / UNCERTAINTY

Purposive 52-city sample is not nationally representative; satellite land-surface temperature differs from human air-temperature exposure. Irrigation was not directly measured and stricter temporal completeness weakened one warming inference.

SOURCE

Landscape Ecology — Kucera et al. (2026)
View original evidence ↗

Read the Wild Lands assessment

October 24, 2026 · Issue 039

The headline this morning is not simply that ecosystems are threatened; it is that measurements change meaning when we ignore place, pathway and denominator. In northern Alaska, most sampled fish showed little PFAS contamination, yet one industrial-adjacent location recorded a very different exposure signal. A new IUCN assessment says 96% of shallow-water reef ecoregions are at critical risk under projected warming—not that 96% have collapsed today. Hungary's lake system shows why shipping corridors, thermal waters and fishponds can each deliver a different invasion history. And China's blue-carbon programs reveal how an ecological estimate becomes credible only when the institutions bearing its long-term uncertainty are actually built. Today's Radar moves from modified deltas and African working lands to overlooked Brazilian microhabitats, Antarctic zooplankton, root-monitoring methods and deep Gulf food webs. The Counter-signal asks what an aquaculture efficiency claim means when the denominator changes; Land Manager Watch asks what indicator can genuinely reveal invasion outcomes.

Land Manager Watch

Evidence for decisions on land, water and habitat

Peer-reviewed observational invaded–uninvaded plot comparison · Lower Silesian Forests, southwestern Poland

An invasive shrub changed a wet meadow's soil-fauna story—but not simply its mite count

Matched plots in Poland complicate how monitoring evaluates plant invasions.

Management read

For wet-meadow invasion assessments, define multiple response metrics—plant dominance, litter chemistry, mite assemblage and recovery trajectory—and use paired reference plots rather than a single soil-fauna abundance total. No removal prescription follows from this study alone.

Caveat / uncertainty: Observational correlations cannot isolate shrub effects from pre-existing soils and seasonal differences; the article's diversity results vary by metric and some post-hoc comparisons are null. No shrub removal or habitat restoration treatment was tested.

Read the full evidence, caveats & Land Manager analysis →

Editorial thread to watch

Across these studies the same trap recurs: a spatial average masks a local contaminant exception, a threatened category becomes mistaken for present collapse, a canal is credited with effects that materialize through later human traffic, and an offset standard is mistaken for successful stewardship. Production ecology offers a parallel warning: yield per meter of rope and yield per meter of seeded twine can move in opposite directions. Monitoring should therefore specify whose outcome matters, the timescale, the measure and the uncertainty before a map or headline is treated as a decision. Place, method, governance and actual implementation remain inseparable.