Skip to content
Ecological Intelligence

Ecological evidence.
Independent perspective.
Explore Wild Lands ↗

Morning Brief Global edition

September 25, 2026 · Issue 015

Today’s brief keeps returning to a deceptively simple problem: the unit we choose to measure can change the story. Shorebird habitat models improve when the surrounding landscape enters the frame; Arctic rivers can neutralize acidity while still carrying metals downstream; a national peat map reveals carbon hidden beneath vegetation classes; and an endangered South African fish persists inside a web of interacting invaders and barriers. Across the radar, methods, spatial scale and implementation capacity repeatedly determine whether a signal looks like recovery, degradation or stability.

Land Manager Watch

Evidence for decisions on land, water and habitat

Peer-reviewed · Bleadon Levels, Somerset, England, United Kingdom

For restored saltmarsh carbon, the buried farm-soil boundary can be the measurement problem

At a 13-hectare English managed-realignment site, calcium and inorganic carbon separated new marine sediment from old agricultural soil more reliably than organic carbon alone.

Management read

For managers or carbon-accounting teams, estimating sequestration requires knowing how much sediment actually accumulated after restoration. Where pre-restoration markers are missing, locally calibrated geochemical indicators can complement cores and elevation data and reduce the risk of assigning old soil carbon to the restoration project.

Caveat / uncertainty: This is one restored site with four cores. Local geology, carbonate supply and sediment sources can change the usefulness of calcium or inorganic-carbon markers, so the method needs site-specific calibration. It improves boundary detection; it does not by itself establish total climate benefit, additionality or a universal carbon-crediting method.

Read the full evidence, caveats & Land Manager analysis →

Editorial thread to watch

Three patterns recur. First, ecological context is part of the mechanism: connectivity, food-web interactions, currents, governance systems and infrastructure shape outcomes that coarse categories miss. Second, monitoring architecture matters: fungal metabarcoding, remote-sensing scale, sediment chemistry and spatial sampling design can change inference without any underlying ecosystem change. Third, formal intervention is not equivalent to function: an MPA can have legal designation before adequate inputs or measurable outcomes, and saltmarsh carbon accounting can fail if the buried agricultural boundary is misidentified. Good ecological intelligence keeps the mechanism, scale and uncertainty attached to the result.

Priority Reads

The evidence that deserves a closer look.

Image placeholder · Rights-cleared imagery pending

For migratory shorebirds, the landscape around a habitat patch improved the prediction

Across six East Asian–Australasian Flyway species, models that added tidal-flat amount, patch density and surrounding land-cover diversity generally outperformed pixel- or distance-only habitat models.

Evidence
Peer-reviewed
Geography
Coastal East Asian–Australasian Flyway
System
Coastal wetlands / migratory shorebird habitat

WHAT THE EVIDENCE SAYS

Across six migratory shorebird species in the non-breeding season, species-distribution models that incorporated neighborhood habitat composition and configuration generally predicted habitat suitability better than conventional pixel-scale or distance-only models. Important predictors included distance to tidal flats and seasonal inland wetlands, tidal-flat area and patch density, land-cover diversity, and elevation; predicted suitability was only weakly positively correlated with observed abundance for most species.

WHY IT MATTERS / OUR READ

Habitat is not only the patch under a bird. For mobile species in heavily altered coastal landscapes, surrounding composition and configuration can change which places function as habitat and can change conservation-priority maps.

CAVEATS / UNCERTAINTY

This is modeling evidence for six species, not a demographic test of survival or population growth. Abundance correlations were weak, and the publisher is currently sharing an accepted early version that remains subject to copyediting.

SOURCE

Communications Earth & Environment
View original evidence ↗
Read the Wild Lands assessment

Alaska’s orange rivers now have a downstream chemistry record, not just a color signal

Across six Brooks Range watersheds, acid-rock-drainage chemistry showed abrupt onset around 2019 and metal enrichment persisted far downstream even where mainstem pH was buffered.

Evidence
Peer-reviewed
Geography
Brooks Range, northwest Arctic Alaska, USA
System
Permafrost-fed river networks

WHAT THE EVIDENCE SAYS

Researchers sampled six affected northwest Arctic Alaska watersheds during 2022–2024 and reconstructed a regional onset around 2019. Acidic, metal-rich tributaries entered larger rivers where acidity could be buffered while elevated metal concentrations persisted far downstream, in some cases for tens of miles.

WHY IT MATTERS / OUR READ

The important monitoring lesson is that visual orange staining and local pH do not describe the whole exposure pathway. A receiving river can buffer acidity while still transporting mobilized metals through the network.

CAVEATS / UNCERTAINTY

This is an emerging, observational river-chemistry phenomenon linked to thawing permafrost and weather history, not a controlled attribution experiment. The authors report no known current human or wildlife harm and no massive fish die-offs; ecological and drinking-water consequences remain under study.

SOURCE

AGU Advances
View original evidence ↗

UC Davis research summary
View research summary ↗

Read the Wild Lands assessment

Belize’s first national peatland inventory changes the carbon map beneath its wetlands

Field-informed mapping estimates peatlands beneath roughly 6% of Belize’s land area and about 165 million tonnes of stored carbon, with mangrove and non-mangrove systems contributing differently than earlier accounting implied.

Belize’s first national peatland inventory changes the carbon map beneath its wetlands
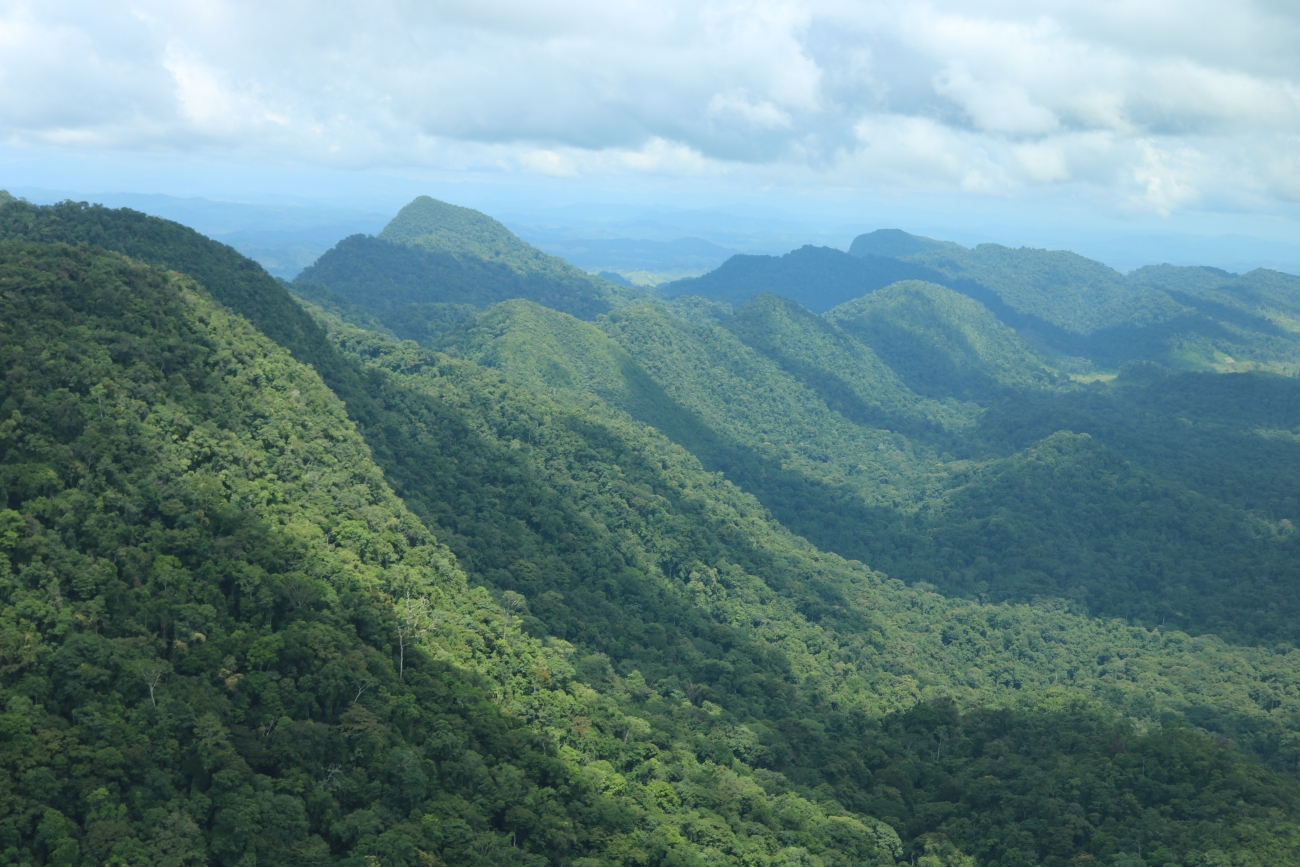
Levi Novey / U.S. Fish & Wildlife Service — illustrative Honduras–Belize landscape image, not study-site peatland documentation. · Public Domain (USFWS) · Rights: Public domain
Evidence
Peer-reviewed
Geography
Belize
System
Tropical peatlands / mangroves / freshwater wetlands

WHAT THE EVIDENCE SAYS

The first national peatland assessment for Belize maps about 1,380 km² of peatland—roughly 6% of national land area—and estimates 165 ± 10 Mt of stored carbon. Mangrove peatlands account for about 115 ± 7 Mt and non-mangrove peatlands about 50 ± 6 Mt; some coastal peat deposits exceed eight meters and began accumulating around 7,500 calibrated years ago.

WHY IT MATTERS / OUR READ

Vegetation maps and peat-carbon maps are not interchangeable. Carbon accounting, land-use planning and wetland protection can change substantially when the soil system beneath mangroves and freshwater wetlands is measured directly rather than inferred from surface cover.

CAVEATS / UNCERTAINTY

This is a national inventory estimate derived from mapped extent plus field cores and geochemical measurements, not an exhaustive census of every peat body. Carbon-stock estimates depend on mapped boundaries, peat depth, bulk density and methodological choices; only about 29% of mapped peatlands were within designated protected areas.

SOURCE

Scientific Reports
View original evidence ↗

Read the Wild Lands assessment

One invasive fish can suppress another—and leave a native remnant in the middle

In South Africa’s Breede River, flow barriers, turbidity and abundant sharptooth catfish appear to damp black-bass predation enough for an endangered whitefish to persist at extremely low frequency.

Evidence
Peer-reviewed
Geography
Breede River, Western Cape, South Africa
System
River fish community

WHAT THE EVIDENCE SAYS

A river survey recorded 2,546 fish representing 17 species, seven of them introduced. Sharptooth catfish frequency was negatively associated with fish diversity, while invasive black bass showed the opposite broad association; flow barriers, high catfish abundance and turbidity appeared to suppress visually hunting bass enough for endangered Berg-Breede whitefish to persist at very low frequency.

WHY IT MATTERS / OUR READ

In invaded systems, management can face interacting pressures rather than one clean native-versus-invasive axis. Removing one stressor can change the effect of another, which makes food-web and barrier context relevant to control decisions.

CAVEATS / UNCERTAINTY

The whitefish remnant is persistence, not recovery. The evidence is observational and site-specific, and antagonism among invasive fishes is not an argument to retain invasive species or barriers; intervention effects would need direct testing.

SOURCE

Biological Invasions
View original evidence ↗

Read the Wild Lands assessment

Global Radar

A wider field of view.

  1. A forest fragment can help a stream even when the rest of the reach is farm country

    Eight Atlantic Forest catchments show upstream and downstream forest fragments buffering different parts of the ecological response to agricultural riparian loss.

    Evidence
    Peer-reviewed
    Geography
    Espírito Santo, Brazil
    System
    Headwater agricultural streams / Atlantic Forest

    WHAT THE EVIDENCE SAYS

    Across 16 reaches in eight agricultural catchments, upstream forest fragments reduced sediment, moderated temperature and increased substrate diversity downstream, while downstream forest reaches supported recovery in invertebrate community attributes. Leaf-litter experiments also showed context-dependent effects on decomposition.

    WHY IT MATTERS / OUR READ

    Riparian protection can have effects that propagate beyond the mapped forest polygon. Placement along the flow network matters as much as simply counting wooded reach length.

    CAVEATS / UNCERTAINTY

    Only eight catchments and four replicates of each reach configuration were studied, so causal generalization is limited. The results are from one Atlantic Forest agricultural landscape and do not quantify every water-quality or biodiversity outcome.

    SOURCE

    Oecologia
    View original evidence ↗

    Read the Wild Lands assessment
  2. Lake Geneva’s sediment record is being written by river intrusions below the surface

    Five years of depth-resolved traps show why river inflow, storms and stratification need to be monitored together rather than treating lake sedimentation as a surface process.

    Evidence
    Peer-reviewed
    Geography
    Lake Geneva / Rhône River, Switzerland and France
    System
    Large lake / river-lake sediment transport

    WHAT THE EVIDENCE SAYS

    Sediment traps at 10, 30, 50 and 100 m from 2020–2024 showed the Rhône as the primary driver of Lake Geneva sedimentation, with density-driven intrusions carrying particles below the thermocline. Floods generated the largest particle fluxes, while drought sharply reduced sediment supply and storms redistributed stored material.

    WHY IT MATTERS / OUR READ

    Monitoring only surface water or annual sediment totals can hide the transport pathway. Stratification and event type determine where river-borne material goes inside a large lake.

    CAVEATS / UNCERTAINTY

    This is one large peri-alpine lake observed from a fixed platform and its associated river network. The study resolves transport well but does not make its exact depth patterns universal to other lakes.

    SOURCE

    Aquatic Sciences
    View original evidence ↗

    Read the Wild Lands assessment
  3. A second leopard-seal hotspot has emerged on Livingston Island

    One austral-summer survey identified 33 unique animals in South Bay, with repeated use, feeding and breeding-associated behavior—enough to justify monitoring, not yet a permanent-site claim.

    Evidence
    Peer-reviewed
    Geography
    South Bay, Livingston Island, South Shetland Islands, Antarctica
    System
    Southern Ocean coastal marine / pinniped aggregation

    WHAT THE EVIDENCE SAYS

    During 34 survey days in the 2025–2026 austral summer, researchers recorded 68 leopard-seal sightings representing 33 unique individuals in South Bay; nine animals were resighted. Most identified animals were adults in good or excellent body condition, and observations included feeding on penguins and seabirds, probable krill feeding, and breeding-associated behavior.

    WHY IT MATTERS / OUR READ

    A wide-ranging predator can still concentrate activity in particular coastal places. If repeated use persists, site-level monitoring and disturbance management around aggregation areas may matter alongside population-scale Southern Ocean conservation.

    CAVEATS / UNCERTAINTY

    This is one field season at one Antarctic bay. Repeated sightings and reproductive behavior do not yet establish long-term site fidelity, a breeding colony, or population trend, and survey effort was constrained by local weather and access.

    SOURCE

    Polar Biology
    View original evidence ↗

    Read the Wild Lands assessment
  4. Aquatic fungi just got a global dataset—and its gaps are as informative as its scale

    FunAqua assembles long-read metabarcoding from 1,452 sites in 87 countries, but Europe supplies more than half the samples and fungal sequencing depth remains uneven.

    Evidence
    Peer-reviewed
    Geography
    Global — 1,452 aquatic sites in 87 countries
    System
    Freshwater and marine aquatic ecosystems

    WHAT THE EVIDENCE SAYS

    The FunAqua data descriptor combines 1,076 sediment and 1,299 filtered-water samples from 1,452 sites in 87 countries and reports 50,152 fungal OTUs using long-read ITS metabarcoding. European samples make up about 56% of the dataset, with freshwater lakes and rivers much more heavily represented than several coastal and specialized aquatic habitats.

    WHY IT MATTERS / OUR READ

    This is valuable as both a biodiversity resource and a map of where the evidence is thin. Global microbial baselines become more useful when sampling geography, biome coverage, sequencing depth and laboratory differences remain visible rather than disappearing behind the word 'global.'

    CAVEATS / UNCERTAINTY

    Sampling is geographically and environmentally uneven, protocols and preservation histories vary among contributing campaigns, ITS barcoding has taxonomic limitations, and recovered DNA does not by itself distinguish actively growing aquatic fungi from spores or material transported into the sample.

    SOURCE

    Scientific Data
    View original evidence ↗

    Read the Wild Lands assessment
  5. Elkhorn coral is genetically more structured across the Caribbean than older markers could see

    High-resolution genotyping resolves nine weakly differentiated clusters and shows ocean currents helping organize gene flow—useful context for restoration broodstock and assisted reproduction.

    Evidence
    Peer-reviewed
    Geography
    Caribbean and western North Atlantic
    System
    Coral reefs

    WHAT THE EVIDENCE SAYS

    A conservation-genomics analysis drew on roughly 3,900 Acropora palmata samples representing about 1,400 genets from 12 regions and 18,898 SNP loci. The authors resolved nine weakly differentiated spatial genetic clusters, found evidence that ocean circulation contributes to connectivity patterns, and identified kinship patterns associated with assisted sexual reproduction and restoration history.

    WHY IT MATTERS / OUR READ

    For coral restoration, 'Caribbean-wide' is too coarse to mean genetically interchangeable. Population structure, current-mediated connectivity and relatedness among nursery or outplant material can all become part of broodstock and assisted-reproduction decisions.

    CAVEATS / UNCERTAINTY

    Genetic differentiation is generally weak and does not by itself measure demographic recovery, local adaptation or transplant performance. Sampling reflects multiple historical programs, and genetic information should be combined with local ecology, disease risk and restoration objectives rather than used as a stand-alone prescription.

    SOURCE

    Conservation Genetics
    View original evidence ↗

    Read the Wild Lands assessment
  6. Thailand’s Racha Islands MPA is further along on designation than on demonstrated outcomes

    An early management-effectiveness audit scored legal context and delivered activities higher than staffing, finance and measured outcomes.

    Evidence
    Peer-reviewed
    Geography
    Racha Islands, Phuket, Thailand
    System
    Coral-reef and tourism marine protected area

    WHAT THE EVIDENCE SAYS

    An assessment of the Racha Islands MPA, established in 2023, used document review, ecological information, field observations and 69 stakeholder respondents during 2025. The reported overall management-effectiveness score was 54.3%, with stronger scores for context and outputs than for inputs and outcomes; many local users perceived major threats as broadly unchanged.

    WHY IT MATTERS / OUR READ

    Protected-area designation creates a governance structure, not an ecological outcome. Early audits are most useful when they expose whether staffing, finance, enforcement, monitoring and baseline data are strong enough to turn legal boundaries into measurable change.

    CAVEATS / UNCERTAINTY

    This is an early post-designation snapshot of a newly established MPA. The respondent pool was modest, there was no comparable pre-designation socioeconomic baseline, ecological indicators had short follow-up, and the study cannot attribute observed conditions to the MPA itself.

    SOURCE

    Environmental Management
    View original evidence ↗

    Read the Wild Lands assessment
  7. Around a Nigerian hydropower reservoir, semi-natural patches held more bird diversity than the disturbed edges

    Across seven Shiroro Reservoir sites, taxonomic and functional diversity varied more by location and disturbance than by broad wet–dry season counts.

    Evidence
    Peer-reviewed
    Geography
    Shiroro Reservoir, Niger State, Nigeria
    System
    Hydropower reservoir / savanna landscape

    WHAT THE EVIDENCE SAYS

    Surveys around seven Shiroro Reservoir sites recorded 21,418 individual birds representing 179 species. Semi-natural habitats supported higher taxonomic and functional diversity than more disturbed or infrastructure-proximate locations; broad species-richness and Shannon responses were not strongly seasonal, although some functional metrics differed between wet and dry periods.

    WHY IT MATTERS / OUR READ

    Large infrastructure landscapes are not ecologically uniform. Retained vegetation structure and semi-natural habitat around reservoir margins can matter for community composition even where the reservoir itself dominates the map.

    CAVEATS / UNCERTAINTY

    This is observational evidence from one reservoir landscape, not a before–after hydropower experiment. Site differences are correlated with several habitat and disturbance factors, and measured vegetation variables explained only part of the variation.

    SOURCE

    Frontiers in Ecology and Evolution
    View original evidence ↗

    Read the Wild Lands assessment
  8. The Caatinga can look stable in the long-term average while local resilience still diverges

    Two decades of remote sensing found little net trend in productivity or water-use efficiency, but strong year-to-year sensitivity to water availability and spatial differences across governance settings.

    Evidence
    Peer-reviewed
    Geography
    Caatinga biome, northeastern Brazil
    System
    Seasonally dry tropical forest / dryland landscape

    WHAT THE EVIDENCE SAYS

    A 2004–2024 remote-sensing analysis of Caatinga vegetation found broadly stable long-term net primary productivity and water-use-efficiency trends at biome scale while year-to-year behavior tracked water availability strongly. The study also detected spatially different trajectories among land-governance categories and near boundaries, showing that broad stability can coexist with localized vulnerability or resilience.

    WHY IT MATTERS / OUR READ

    Biome-wide averages can be reassuring and still be poor management maps. In drylands, surface-water availability, edge context and governance history can separate local trajectories that disappear when the whole region is averaged together.

    CAVEATS / UNCERTAINTY

    The analysis relies on remotely sensed productivity and water-use-efficiency proxies rather than direct biodiversity or demographic measurements. Governance categories are correlated with landscape history and site conditions, so differences among them should not be read as simple causal effects of tenure or protection status.

    SOURCE

    Environmental Management
    View original evidence ↗

    Read the Wild Lands assessment
  9. Patagonia’s burrowing parrots are eating a diet dominated by introduced plants

    Year-round fecal metabarcoding found only a small native share of detected plant taxa, a striking shift that could signal flexibility—or a poorer substitute.

    Evidence
    Peer-reviewed
    Geography
    El Cóndor, northeastern Patagonia, Argentina
    System
    Patagonian steppe / coastal parrot foraging landscape

    WHAT THE EVIDENCE SAYS

    Fecal DNA metabarcoding across the annual cycle of a Burrowing Parrot colony detected 202 plant molecular operational taxonomic units. About 40% were introduced and another 4.5% presumed introduced, while roughly 13% were native; diet diversity was highest in the post-breeding period.

    WHY IT MATTERS / OUR READ

    A species can persist while its food web changes around it. Diet flexibility may buffer land-use change, but heavy use of introduced plants should not automatically be interpreted as equivalent habitat quality or evidence that native foraging resources no longer matter.

    CAVEATS / UNCERTAINTY

    Metabarcoding detects plant DNA rather than consumed biomass, energetic value or fitness benefit and may not identify the route by which every plant entered the diet. This is one colony, and the study cannot determine whether the shift reflects adaptive flexibility, necessity or a suboptimal diet.

    SOURCE

    The Science of Nature
    View original evidence ↗

    Read the Wild Lands assessment
  10. NOAA has opened the next Atlantic whale–fixed-gear management redesign before proposing a rule

    The current scoping process is considering gear, effort and spatial-management options across U.S. East Coast fixed-gear fisheries; it is an options-setting stage, not a final regulation.

    Evidence
    Other
    Geography
    U.S. Atlantic coast
    System
    Marine mammal–fixed-gear fishery interaction

    WHAT THE EVIDENCE SAYS

    NOAA Fisheries has begun environmental-review scoping for potential modifications to the Atlantic Large Whale Take Reduction Plan. The notice considers regulated commercial fixed-gear fisheries and a range of possible measures involving vertical lines and gear configuration, fishing effort, line breaking strength, seasonal or dynamic areas, and gear marking; public scoping includes a September 24 meeting and comments through October 16.

    WHY IT MATTERS / OUR READ

    This is a live decision-design stage where ecological evidence, whale distribution, fishery operations and gear feasibility can still shape the alternatives being analyzed. The useful signal is the structure of the decision, not an assumption about which option will prevail.

    CAVEATS / UNCERTAINTY

    This is scoping for an environmental analysis, not a proposed or final rule. Listed options are alternatives for evaluation rather than adopted requirements, and ecological, operational and economic effects remain to be analyzed.

    SOURCE

    NOAA Fisheries — Notice of Intent
    View original evidence ↗

    NOAA Fisheries — scoping meeting
    View supporting source ↗

    Read the Wild Lands assessment

Landscape / City Watch

Cities are ecological systems.

Change the map scale and Hangzhou Bay’s ecological trend changes with it

A 25-year remote-sensing analysis found coarse administrative units made improvement look more widespread while hiding local opposing trends along urban corridors and the bay.

Evidence
Peer-reviewed
Geography
Hangzhou Bay Urban Agglomeration, China
System
Urban / coastal metropolitan landscape

WHAT THE EVIDENCE SAYS

A Google Earth Engine analysis tracked a remote-sensing ecological index from 2000–2024 at 1-, 3-, 5- and 10-km grids and county scale. The regional RSEI increased by about 0.0423 overall, but the share classified as improving rose from 75.34% at 1 km to 84.25% at county scale, demonstrating how aggregation can hide opposing local trajectories. Land-use intensity was the strongest SHAP contributor in the explanatory model.

WHY IT MATTERS / OUR READ

For metropolitan ecological planning, scale is part of the result. County or city averages can be useful for screening, but site and corridor decisions need nested spatial analysis so local degradation is not erased by improvement elsewhere.

CAVEATS / UNCERTAINTY

RSEI combines greenness, wetness, dryness and surface temperature; it is not a direct biodiversity or ecosystem-integrity measure. The study is observational and cannot assign causal effects to land use or policy, and its machine-learning validation was not designed as a strict spatial or temporal holdout test.

SOURCE

Frontiers in Ecology and Evolution
View original evidence ↗

Read the Wild Lands assessment

September 25, 2026 · Issue 015

Today’s brief keeps returning to a deceptively simple problem: the unit we choose to measure can change the story. Shorebird habitat models improve when the surrounding landscape enters the frame; Arctic rivers can neutralize acidity while still carrying metals downstream; a national peat map reveals carbon hidden beneath vegetation classes; and an endangered South African fish persists inside a web of interacting invaders and barriers. Across the radar, methods, spatial scale and implementation capacity repeatedly determine whether a signal looks like recovery, degradation or stability.

Land Manager Watch

Evidence for decisions on land, water and habitat

Peer-reviewed · Bleadon Levels, Somerset, England, United Kingdom

For restored saltmarsh carbon, the buried farm-soil boundary can be the measurement problem

At a 13-hectare English managed-realignment site, calcium and inorganic carbon separated new marine sediment from old agricultural soil more reliably than organic carbon alone.

Management read

For managers or carbon-accounting teams, estimating sequestration requires knowing how much sediment actually accumulated after restoration. Where pre-restoration markers are missing, locally calibrated geochemical indicators can complement cores and elevation data and reduce the risk of assigning old soil carbon to the restoration project.

Caveat / uncertainty: This is one restored site with four cores. Local geology, carbonate supply and sediment sources can change the usefulness of calcium or inorganic-carbon markers, so the method needs site-specific calibration. It improves boundary detection; it does not by itself establish total climate benefit, additionality or a universal carbon-crediting method.

Read the full evidence, caveats & Land Manager analysis →

Editorial thread to watch

Three patterns recur. First, ecological context is part of the mechanism: connectivity, food-web interactions, currents, governance systems and infrastructure shape outcomes that coarse categories miss. Second, monitoring architecture matters: fungal metabarcoding, remote-sensing scale, sediment chemistry and spatial sampling design can change inference without any underlying ecosystem change. Third, formal intervention is not equivalent to function: an MPA can have legal designation before adequate inputs or measurable outcomes, and saltmarsh carbon accounting can fail if the buried agricultural boundary is misidentified. Good ecological intelligence keeps the mechanism, scale and uncertainty attached to the result.