Skip to content
Ecological Intelligence

Ecological evidence.
Independent perspective.
Explore Wild Lands ↗

Morning Brief Global edition

October 19, 2026 · Issue 034

Conservation outcomes do not travel neatly with our management labels. In Michigan, rare salt-marsh plants disappeared from a groundwater-fed habitat even while the marsh remained on the map—a reminder that acreage alone does not preserve a distinctive community. In Afghanistan, tree cover grew in surveyed agricultural areas without establishing whether native forests recovered. On the Klamath River, Chinook returned remarkably quickly after dam removal—an ecological response worth celebrating without mistaking passage for population recovery. Today's evidence asks what changed, where, and how confidently we know.

Land Manager Watch

Evidence for decisions on land, water and habitat

Peer-reviewed · Eastern United States; northern Michigan, Northeast and Appalachian highlands

American chestnut restoration maps need more than post-blight occurrence points

A forest-community model locates possible restoration partners and sites—but does not test which planted chestnuts will survive.

Management read

For restoration projects, use climate-aware community maps to prioritize candidate sites, then test soils, disease resistance, planting material, landowner goals and actual site conditions. A model is a screening layer for experimental planting—not a field prescription or a forecast of successful chestnut recovery.

Caveat / uncertainty: Predicted associated-tree suitability is not direct chestnut survival, seedling recruitment or blight-resistance performance. Climate scenario uncertainty, land-use constraints and the suitability of specific planting stock require site-level verification.

Read the full evidence, caveats & Land Manager analysis →

Editorial thread to watch

The thread is the difference between a mapped asset and a measured ecological result. Marsh vegetation, agricultural tree cover and salmon passage measure different dimensions of change. The radar follows conditional bird-fire exposure, taxon-specific reserve responses, Amazon microplastic null contrasts, wetland bathymetry, fewer ignitions amid more area burned, mistimed bird surveys, Pantanal fire-flood interactions, reef habitat connectivity, grazed grassland food webs and mangrove carbon baselines. Peatland rewetting supplies the counter-signal: higher initial methane emissions need to be interpreted within a fuller climate account. The Land Manager Watch uses warming-specific chestnut community projections to screen sites for experimental planting, not to promise success. Management remains an exercise in choosing an appropriate outcome measure and revisiting it over time.

Priority Reads

The evidence that deserves a closer look.

Rare inland salt marsh plants disappeared as an invasive matrix took hold
Monica Tomosy. Illustrative North American wetland; not either Michigan salt-marsh study site. · Public domain — U.S. Fish & Wildlife Service media asset. · Rights: Public domain

Rare inland salt marsh plants disappeared as an invasive matrix took hold

Forty-year vegetation comparisons in Michigan show how a small groundwater-fed habitat can change without leaving the map.

Evidence
Peer-reviewed
Geography
Clinton Saltworks and Hubbard Salt Lick, Michigan, USA
System
Groundwater-fed inland saline marshes; rare halophytes; invasive plants

WHAT THE EVIDENCE SAYS

At the Clinton Saltworks inland salt marsh, comparisons with surveys from the early 1980s documented the apparent loss from the sampled community of two state-endangered salt-tolerant plants, alongside greater invasive reed-canary grass dominance and reduced salinity. At a second marsh, Hubbard Salt Lick, invasive cattails made plant assemblages more uniform and competed with the rare plants, though those species persisted adjacent to the active saline seep.

WHY IT MATTERS / OUR READ

Protecting a boundary or a wetland acreage does not preserve the unusual groundwater chemistry or the rare community that depends on it. For small edaphic islands, prioritize seep hydrology, vegetation trajectories and opportunistic invasion before a regional wetland-cover layer makes the site look stable.

CAVEATS / UNCERTAINTY

Only two marsh sites were studied, with imperfectly relocated historical transects and several environmental changes occurring together. The findings cannot assign all changes to a single invasive species or promise that invasive control alone restores saline groundwater conditions.

SOURCE

Gustafson et al. · Biodiversity and Conservation · Michigan inland salt marsh study
View original evidence ↗
Read the Wild Lands assessment

Tree cover grew on Afghan farmland—but that does not establish forest recovery

High-resolution satellite comparisons reveal agricultural tree gains that should not be mistaken for recovery of native forest.

Evidence
Peer-reviewed
Geography
Four districts, Nangarhar Province, eastern Afghanistan; imagery 2016, 2020, 2024
System
Agroforestry; farm-tree cover; deforestation; conflict-affected land use

WHAT THE EVIDENCE SAYS

Three-meter satellite imagery and object-based classification tracked agricultural areas in four eastern Afghan districts from 2016 to 2024. Mapped tree cover rose from 369.26 to 502.58 hectares, a 36.1% increase, mainly through cropland-to-tree-cover transitions. Natural forests were excluded from the mapped areas; the paper's wider deforestation discussion draws on earlier regional evidence rather than a new measurement of surrounding forest loss. Classification agreement was 0.80 or higher.

WHY IT MATTERS / OUR READ

Tree-cover gain is a useful signal, but neither its cause nor its ecological value follows automatically. Distinguish deliberate planting from natural regrowth, and farm production from native-forest condition, before crediting a program or calling a landscape restored.

CAVEATS / UNCERTAINTY

These are selected agricultural areas in four districts, not complete district totals or a national forest estimate. Imagery alone could not distinguish deliberate planting from natural regeneration, quantify biodiversity or identify a causal effect of political change. Classification error and image timing remain limitations.

SOURCE

Razmju et al. · Environmental Monitoring and Assessment · eastern Afghanistan land-cover study
View original evidence ↗

Read the Wild Lands assessment

Chinook salmon rapidly reclaimed river miles after the Klamath dams came out

Two migration seasons provide a quantitative measure of passage—not yet a verdict on population recovery.

Chinook salmon rapidly reclaimed river miles after the Klamath dams came out
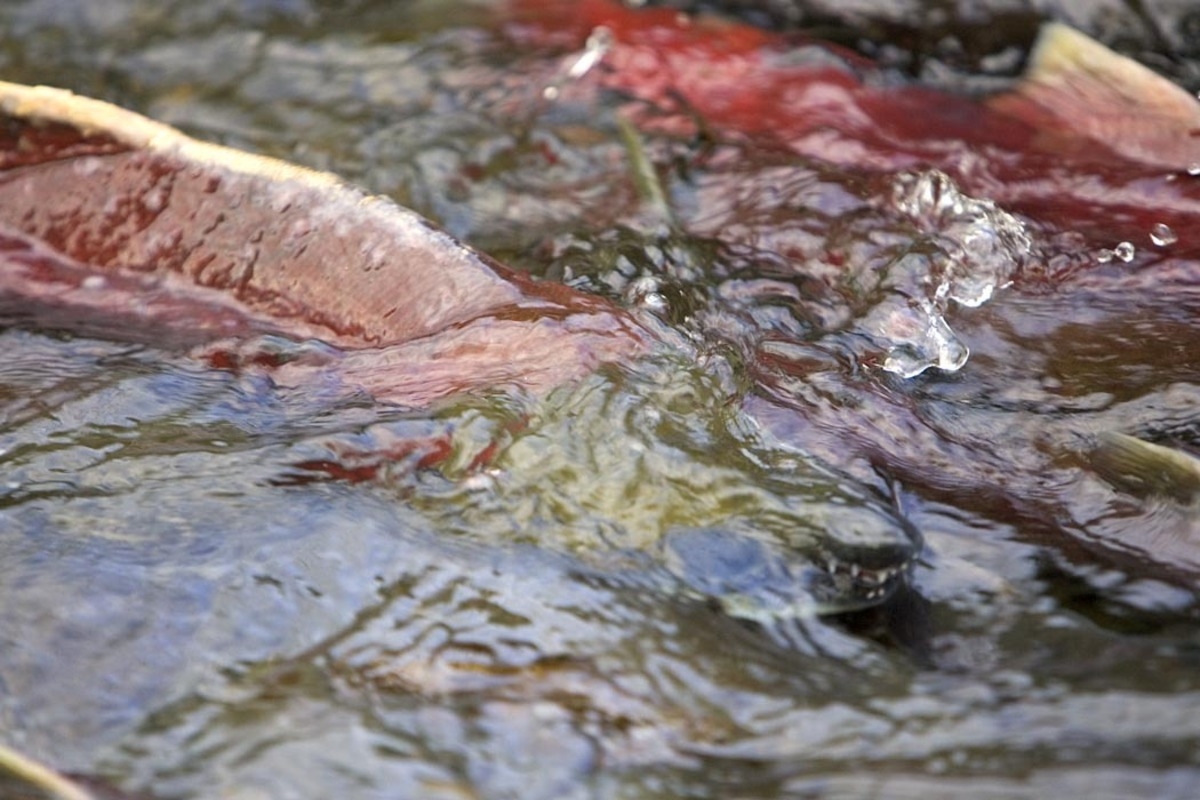
Steve Hillebrand/USFWS. Illustrative salmon in an Alaskan stream; not a Klamath River study photograph. · Public domain — U.S. Fish & Wildlife Service media asset. · Rights: Public domain
Evidence
Peer-reviewed
Geography
Upper Klamath River Basin, California and Oregon, USA; 2024–2025 surveys
System
River reconnection; salmon migration; dam removal; habitat restoration

WHAT THE EVIDENCE SAYS

After four Klamath River hydroelectric dams were removed in 2024, a multisector research team used multibeam sonar and field surveys to estimate 7,742 adult Chinook passing into reopened reaches in the 2024 migration and 13,310 in 2025. Fish reached 345 kilometers of reconnected habitat—88% of their documented historical distribution—and navigated former dam sites and modified hydraulic passages.

WHY IT MATTERS / OUR READ

The early signal is that connectivity can convert restored access into actual animal movement remarkably quickly. The next management questions are more demanding: survival, successful reproduction, cold-water refuge, water quality, species-specific run timing and whether Tribal and agency restoration goals are met over many generations.

CAVEATS / UNCERTAINTY

The 88% figure describes documented historical river length reoccupied, not recovery to 88% of the former salmon population. Counts are modeled sonar estimates for two seasons and primarily likely fall-run fish; long-term recruitment and spring-run restoration remain unresolved.

SOURCE

Goodman et al. · Scientific Reports · Klamath dam-removal Chinook monitoring
View original evidence ↗

Read the Wild Lands assessment

Global Radar

A wider field of view.

  1. Bird-diversity hotspots differed in modeled exposure to severe fire

    Maps distinguish possible low-severity refugia from high-diversity places expected to burn severely if a fire occurs.

    Evidence
    Peer-reviewed
    Geography
    Western United States; biodiversity and fire-exposure modeling
    System
    Forest birds; changing fire regimes; biodiversity risk modeling

    WHAT THE EVIDENCE SAYS

    Researchers combined western U.S. bird-distribution maps with fire-severity predictions based on landscape and climate conditions in 2016. About 55–58% of mapped biodiversity hotspots intersected predicted low-severity fire and were classified as potential refugia; 24–30% intersected predicted high severity and were areas of concern. Roughly 52–60% of those concern areas historically experienced low-severity fire regimes. The model estimates severity conditional on a fire occurring, not ignition timing or a future warming scenario.

    WHY IT MATTERS / OUR READ

    The useful planning move is to overlay diversity priorities with expected disturbance character, not treat all hotspots as uniformly protected or uniformly threatened. Habitat refugia designation should be paired with field validation and species-response monitoring.

    CAVEATS / UNCERTAINTY

    These percentages describe modeled spatial classes, not measured future species losses. The severity product represents 2016 conditions and may miss subsequent fuel changes; it is not a forecast of future climate or when a fire will occur. High-severity fire does not affect every species equally.

    SOURCE

    Norman et al. · Nature Communications · predicted wildfire exposure and birds
    View original evidence ↗

    Read the Wild Lands assessment
  2. Forest reserve size mattered, but different taxa responded to different habitat features

    A 44-reserve European comparison complicates the idea of one universal biodiversity indicator.

    Evidence
    Peer-reviewed
    Geography
    44 riparian, upland and mountain forest reserves, Central Europe
    System
    Protected forest reserves; beetles; spiders; birds; soil fungi

    WHAT THE EVIDENCE SAYS

    Researchers measured diversity of beetles, spiders, birds and soil fungi in 44 protected forests. Fungi, beetle and spider diversity increased with reserve size; bird diversity showed interactions between reserve size and surrounding forest cover, while certain forest specialists showed no simple area response. Deadwood, canopy-height diversity and tree microhabitats had different relationships to different taxa.

    WHY IT MATTERS / OUR READ

    The area available to ecological processes matters, but structure and forest context determine which organisms benefit. Reserve design should consider expansion and forest-specific habitat features rather than declaring success from total hectares or one focal species.

    CAVEATS / UNCERTAINTY

    The study is observational across three forest types, and measured associations need not indicate effects caused by reserve designation. Individual taxonomic groups and local forest specialists differed markedly.

    SOURCE

    Huber et al. · Biodiversity and Conservation · 44 forest reserves
    View original evidence ↗

    Read the Wild Lands assessment
  3. Amazon floodplain microplastics appeared at both fishing and settlement sites

    A newly published lake survey found pervasive particles but no significant contrast between its land-use groupings.

    Evidence
    Peer-reviewed
    Geography
    Lake Canaçari, Central Amazon, Brazil; dry-season sampling
    System
    Floodplain lake; microplastic monitoring; freshwater sediments

    WHAT THE EVIDENCE SAYS

    Dry-season sampling detected microplastics across surveyed areas of Amazonian Lake Canaçari. Water concentrations ranged from no particles in one sample to 1,000 particles per cubic meter, averaging about 405; sediments ranged from 7 to 307 particles per kilogram, averaging about 77. Blue fibers dominated, and fishing-versus-settlement sampling groups did not differ significantly in measured particle concentrations.

    WHY IT MATTERS / OUR READ

    A mapped local human-use category can be a poor proxy for where mobile contaminants accumulate in connected floodplain waters. Repeated seasonal and hydrologic monitoring is needed before a management team attributes material to a specific shore use.

    CAVEATS / UNCERTAINTY

    These are field detections during one hydrologic season, not proof of source, toxic dose or ecosystem damage. No significant between-group difference is not evidence that all locations or all seasons are equivalent.

    SOURCE

    Guimarães et al. · Environmental Monitoring and Assessment · Amazon lake microplastics
    View original evidence ↗

    Read the Wild Lands assessment
  4. A consumer-grade sonar can map small-wetland depth with useful agreement

    Three seasonally flooded wetlands show a practical way to reduce one persistent data gap in hydrology.

    Evidence
    Peer-reviewed
    Geography
    Three geographically isolated seasonal wetlands, southeastern United States
    System
    Ephemeral isolated wetlands; bathymetry; water storage; monitoring methods

    WHAT THE EVIDENCE SAYS

    Investigators developed interpolated one-meter wetland bathymetry surfaces from a commercial sonar fish finder in three seasonally inundated wetlands, then compared those surfaces with terrestrial lidar measurements collected when dry. Their depth–area–volume relationships achieved Nash–Sutcliffe efficiency values of at least 0.85 relative to lidar benchmarks.

    WHY IT MATTERS / OUR READ

    Small wetlands are often managed from an acreage and a rough depth estimate even when storage volume and hydroperiod govern their ecological roles. A repeatable low-cost field method can improve hydrologic decisions if paired with water-level observations and sound sampling geometry.

    CAVEATS / UNCERTAINTY

    Only three wetlands were tested; mapped precision depends on site geometry, sonar coverage, interpolation and water conditions. Agreement with lidar is not a demonstration of long-term ecological outcomes or universally transferable accuracy.

    SOURCE

    Perkins et al. · Wetlands · low-cost isolated-wetland bathymetry method
    View original evidence ↗

    Read the Wild Lands assessment
  5. The West burned more area while recorded fire counts declined

    Western U.S. ignition trends tell a different story from the rise in burned area.

    Evidence
    Peer-reviewed
    Geography
    Western United States; fire-occurrence records 1992–2020
    System
    Wildfire history; human ignitions; fire-climate interactions

    WHAT THE EVIDENCE SAYS

    A screened 1992–2020 wildfire occurrence dataset showed a significant decline in annual fire frequency across the western United States even as burned area and damages increased. Human-caused ignitions declined strongly in California and Arizona but rose in Wyoming, suggesting a geographically variable relationship with population and land use.

    WHY IT MATTERS / OUR READ

    Fire management and policy should avoid collapsing ignition counts, fire size, area burned and ecological severity into a single trend. The drivers of more extensive burning may differ from the drivers of the number of ignition events.

    CAVEATS / UNCERTAINTY

    Trends depend on dataset reporting corrections, size classes and geography. A decrease in counts does not mean wildfire risk or severity has fallen, and the observed population correlations do not independently prove cause.

    SOURCE

    Madakumbura et al. · Earth's Future · western wildfire frequency assessment
    View original evidence ↗

    Read the Wild Lands assessment
  6. Wind-farm bird surveys often missed the season when migrants were present

    Comparing 70 eastern Australian projects against weekly occurrence patterns exposes a preventable monitoring blind spot.

    Evidence
    Peer-reviewed
    Geography
    70 wind-farm impact assessments, eastern Australia
    System
    Renewable-energy infrastructure; migratory birds; biodiversity impact assessment

    WHAT THE EVIDENCE SAYS

    Researchers reviewed surveys for four migratory species at 70 wind-farm developments and compared field timing with eBird-based weekly relative-abundance patterns. About half of assessed surveys were outside the modeled optimum; around one-fifth missed the modeled potential presence window altogether. Less well-timed surveys were associated with lower stated likelihood-of-occurrence judgments.

    WHY IT MATTERS / OUR READ

    Environmental impact assessment is only as representative as the period spent observing. A technically correct field protocol conducted at the wrong seasonal window can falsely reassure a project team, so baseline survey design should incorporate migration phenology before fieldwork begins.

    CAVEATS / UNCERTAINTY

    Weekly abundance predictions and archival assessment records are imperfect. The analysis addresses survey timing and estimated occurrence, not a quantified collision-mortality effect attributable to these 70 wind farms.

    SOURCE

    Shi et al. · Journal of Applied Ecology · migratory bird survey timing
    View original evidence ↗

    Read the Wild Lands assessment
  7. In Pantanal wetlands, fire timing interacted with flooding and herbivory

    Experimental plots show that one burn regime cannot represent the ecological needs of an entire floodplain.

    Evidence
    Peer-reviewed
    Geography
    Brazilian Pantanal; 32 one-hectare experimental plots
    System
    Tropical wetlands; fire; flooding; grazed herbaceous vegetation

    WHAT THE EVIDENCE SAYS

    Researchers compared fire treatments and flood-level zones across 32 one-hectare plots in the Brazilian Pantanal, with biomass indicators of herbivory. In lower-flood areas, some lower-intensity early and late fires supported higher diversity, while high-intensity modal fires reduced taxonomic and functional diversity, especially where inundation was high; the modeled herbivory interaction sometimes compounded losses.

    WHY IT MATTERS / OUR READ

    The ecological unit for prescribed-fire planning should include local hydrology and grazing context. A mosaic of burn timing and flood environments may support distinct vegetation trajectories where a rigid fire interval would erase useful variation.

    CAVEATS / UNCERTAINTY

    The experiment is specific to sampled Pantanal communities and treatment definitions, and herbivory was inferred from biomass rather than independently randomized grazing access. Its results do not supply a transferable burn calendar.

    SOURCE

    Pereira et al. · Wetlands Ecology and Management · Pantanal fire-flood study
    View original evidence ↗

    Read the Wild Lands assessment
  8. Florida Keys reef fish preferred different habitat corridors despite shared reef drivers

    Seascape models show why protecting a reef patch alone may miss life-stage movements.

    Evidence
    Peer-reviewed
    Geography
    Florida Keys, United States; five focal fish species and 58 management zones
    System
    Coral reef seascapes; fish ontogeny; nearshore-offshore connectivity

    WHAT THE EVIDENCE SAYS

    A MaxEnt habitat-suitability analysis examined five habitat-shifting predatory and herbivorous reef fish and assessed 58 existing management zones in the Florida Keys. Patch and aggregate reefs were especially suitable, yet predicted spatial use differed between species and feeding guilds. The study's restoration zones scored higher in modeled suitability than protection zones, and patch reefs were relatively underrepresented.

    WHY IT MATTERS / OUR READ

    Fisheries habitat decisions need life-stage and movement pathways, not merely a map of adult reef habitat. Include patch reefs, nursery connections and the distinct routes of different feeding guilds when considering restoration or area protection.

    CAVEATS / UNCERTAINTY

    The findings are modeled associations and relative habitat suitability, not measured recruitment, reserve success or an experimental comparison demonstrating that restoration zones outperform protection zones.

    SOURCE

    Spence et al. · Landscape Ecology · Florida Keys reef-fish seascapes
    View original evidence ↗

    Read the Wild Lands assessment
  9. Removing herbivores did not simply undo invasive-grass effects

    A six-farm Australian experiment linked mammal exclusion and African lovegrass invasion to changing microbes and arthropods.

    Evidence
    Peer-reviewed
    Geography
    Six livestock-grazed farms in temperate Australian grassy woodlands
    System
    Native grassy woodlands; invasive grasses; herbivory; foliar microbiomes

    WHAT THE EVIDENCE SAYS

    Across six Australian farms, researchers nested herbivore-exclusion treatments in plots dominated by native kangaroo grass or co-dominated by invasive African lovegrass. Invasion and herbivore exclusion both altered litter, microclimate, leaf-associated microbial communities and arthropod assemblages. Phyllosphere diversity generally declined under the interacting disturbances, and mammal exclusion changed fungal infection patterns affecting the native grass.

    WHY IT MATTERS / OUR READ

    The most useful management signal is that grazing and invasion cannot always be treated as independent switches. The ecological result of removing herbivores depends on which native and invasive species—and microbial interactions—are present; evaluate the whole plant–consumer system.

    CAVEATS / UNCERTAINTY

    Experimental results are local to six grazed farms and nested treatments. 'Buffering' by some herbivores is not a universal endorsement of livestock grazing or evidence of recovery in native plant populations.

    SOURCE

    Fioratti Junod et al. · iScience · grassland invasion and herbivore exclusion
    View original evidence ↗

    Read the Wild Lands assessment
  10. Three Philippine mangrove stands told different stories about biodiversity and carbon

    Zamboanga field plots separate surviving mature forest condition from tree-cover restoration activity.

    Evidence
    Peer-reviewed
    Geography
    Talabaan, Victoria and Great Sta. Cruz Island, Zamboanga City, Philippines
    System
    Mangrove forests; species composition; aboveground biomass and carbon stocks

    WHAT THE EVIDENCE SAYS

    Field surveys across three mangrove stands and 72 quadrats identified 15 mangrove species, with Rhizophora taxa common. Diversity varied among sites, and the mature Great Sta. Cruz Island stand had the highest estimated aboveground carbon stock at 41.61 tonnes of carbon per hectare. Reforested sites contributed vegetation cover but did not show identical measured diversity or estimated carbon levels.

    WHY IT MATTERS / OUR READ

    Restoration projects need metrics beyond planting area. Stand age, species composition, biomass and the hydrologic setting all matter when comparing planted mangroves with protected natural stands; sampling can reveal tradeoffs hidden by a satellite-green coastline.

    CAVEATS / UNCERTAINTY

    These are snapshots of three sites, not a controlled before-after comparison or whole-ecosystem carbon budget. Estimates are aboveground biomass carbon, not demonstrated rates of sequestration or storm-protection performance.

    SOURCE

    Epan et al. · Biodiversitas · Zamboanga mangrove field assessment
    View original evidence ↗

    Read the Wild Lands assessment

Landscape / City Watch

Cities are ecological systems.

In suburban monitoring, big moths were only a partial proxy for the smaller ones

Six years of Swiss light traps show why a shortcut to urban biodiversity depends on taxon and time scale.

Evidence
Peer-reviewed
Geography
Suburban Basel, Switzerland; two light traps over 2016–2021, with one relocated in the final year
System
Suburban biodiversity; nocturnal insects; indicator selection

WHAT THE EVIDENCE SAYS

Two light traps sampled suburban sites near Basel over six years, with one relocated in the final year. Researchers identified 17,404 moths representing 515 species. Annual samples of larger moths, especially noctuids, moderately predicted smaller-moth diversity, while geometrids were not dependable surrogates and weekly predictions were weaker and season-dependent.

WHY IT MATTERS / OUR READ

City biodiversity dashboards are most useful when their 'indicator species' assumption is tested. Selecting one tractable group can save monitoring effort, but proxy relationships may vary by season and different neighborhoods.

CAVEATS / UNCERTAINTY

The study sampled two traps across three locations, not all urban habitats or insect groups. Site relocation, weather, phenology and identification effort constrain transferability; moderate association is not full community coverage.

SOURCE

Schmera et al. · Biodiversity and Conservation · suburban moth monitoring
View original evidence ↗

Read the Wild Lands assessment

October 19, 2026 · Issue 034

Conservation outcomes do not travel neatly with our management labels. In Michigan, rare salt-marsh plants disappeared from a groundwater-fed habitat even while the marsh remained on the map—a reminder that acreage alone does not preserve a distinctive community. In Afghanistan, tree cover grew in surveyed agricultural areas without establishing whether native forests recovered. On the Klamath River, Chinook returned remarkably quickly after dam removal—an ecological response worth celebrating without mistaking passage for population recovery. Today's evidence asks what changed, where, and how confidently we know.

Land Manager Watch

Evidence for decisions on land, water and habitat

Peer-reviewed · Eastern United States; northern Michigan, Northeast and Appalachian highlands

American chestnut restoration maps need more than post-blight occurrence points

A forest-community model locates possible restoration partners and sites—but does not test which planted chestnuts will survive.

Management read

For restoration projects, use climate-aware community maps to prioritize candidate sites, then test soils, disease resistance, planting material, landowner goals and actual site conditions. A model is a screening layer for experimental planting—not a field prescription or a forecast of successful chestnut recovery.

Caveat / uncertainty: Predicted associated-tree suitability is not direct chestnut survival, seedling recruitment or blight-resistance performance. Climate scenario uncertainty, land-use constraints and the suitability of specific planting stock require site-level verification.

Read the full evidence, caveats & Land Manager analysis →

Editorial thread to watch

The thread is the difference between a mapped asset and a measured ecological result. Marsh vegetation, agricultural tree cover and salmon passage measure different dimensions of change. The radar follows conditional bird-fire exposure, taxon-specific reserve responses, Amazon microplastic null contrasts, wetland bathymetry, fewer ignitions amid more area burned, mistimed bird surveys, Pantanal fire-flood interactions, reef habitat connectivity, grazed grassland food webs and mangrove carbon baselines. Peatland rewetting supplies the counter-signal: higher initial methane emissions need to be interpreted within a fuller climate account. The Land Manager Watch uses warming-specific chestnut community projections to screen sites for experimental planting, not to promise success. Management remains an exercise in choosing an appropriate outcome measure and revisiting it over time.